2011–2012: 1st and 2nd Quarters Combined
Table of Contents
- Nutrition North Canada provided $23.8 million in subsidy between April 1 and September 30, 2011, to help increase access to nutritious perishable and non-perishable foods in eligible communities. Certain non-food items were also subsidized. Communities in the Baffin Region of Nunavut and in the Nunavik Region of Quebec received 40% and 25% of the total, respectively.
- The foods that received the largest amount of subsidy between April and September were bread, fresh 2% milk, frozen and fresh meat, frozen potato products, eggs, yogurt, bananas, fresh potatoes and unsweetened juice (containers of 250 ml or less). Together, they received 45% of the total subsidy payments made during the 6-month period. All these foods are eligible for the program's higher subsidy level.
- Of the items eligible for the lower subsidy level, frozen pizza, fresh unsweetened juice, diapers, frozen combination foods, ice cream, and unsweetened juice (in containers of more than 250 ml) received the most subsidy. Together, they accounted for 6% of total subsidy payments.
- Prescription drugs, vitamin and mineral supplements, disposable underwear, plain frozen pasta, nursing pads, medical devices, canned sweetened milk, and yeast received the smallest amount of subsidy overall. This can be explained in part by the small volume of these items that was shipped by plane to eligible communities and the fact that most are eligible for the lower subsidy level. Also, retailers may have used the sea-lift to ship some of these items since it is cheaper than sending them by plane and claiming the NNC subsidy.
- Country foods from suppliers in the South were subsidized by the program. The small amount of subsidy that was provided reflects the small volume that was shipped to eligible communities.
- The program subsidized over 13.2 million kilograms of perishable food, non-perishable food and non-food items during its first six months of operation. Ninety-one percent (91%) of this volume was going to stores operating in the communities, which is where the majority of residents shop for food. Three percent of subsidized items was intended for commercial establishments like hotels or restaurants, 5% for individuals who made direct or "personal orders" and 2% for school-based programs and similar social institutions.
Data by product category
This table shows the amount of subsidy that was distributed by product category between October 1, 2011 and December 31, 2011, and the weight of the products that were subsidized during this period. Product categories are listed in descending order based on the amount of subsidy; the category that received the highest amount of subsidy is listed first, followed by the category that received the second highest amount of subsidy, and so on.
| Product category | $ subsidy | % total $ | kg | % total kg |
|---|---|---|---|---|
| Vegetables and fruit (fresh and frozen) |
6,669,476 | 28% | 3,103,891 | 23% |
| Meat, poultry and fish (fresh and frozen) |
3,744,164 | 16% | 1,925,582 | 15% |
| Milk (fresh, UHT, and canned evaporated) |
3,423,305 | 14% | 1,778,813 | 13% |
| Bread and bread products, cereals, crackers, flour and plain fresh and frozen pasta |
2,633,497 | 11% | 1,381,703 | 10% |
| Products eligible until October 1, 2012 |
2,072,087 | 9% | 2,023,561 | 15% |
| Cheese, yogurt and other dairy products |
1,511,065 | 6% | 807,565 | 6% |
| Unsweetened juice | 1,295,260 | 5% | 645,245 | 5% |
| Eggs and egg substitutes | 950,267 | 4% | 581,971 | 4% |
| Combination foods (fresh and frozen) | 716,836 | 3% | 496,300 | 4% |
| Cooking oils, margarine, lard, shortening, butter, mayonnaise and salad dressing |
356,404 | 1% | 285,127 | 2% |
| Infant formula and foods prepared specifically for infants |
292,742 | 1% | 161,334 | 1% |
| Nuts, seeds, peanut butter and other nut butters, tofu and other meat alternatives |
87,273 | 0% | 41,295 | 0% |
| Non-prescription drugs | 8,938 | 0% | 7,703 | 0% |
| Total | 23,761,315 | 100% | 13,240,090 | 100% |
| Note: Numbers may not add up due to rounding. Last modified: 2012-08-09. |
||||
This chart shows what percentage of the total subsidy transfer between April 1, 2011 and September 30, 2011 was applied to specific product categories. Because non-prescription drugs received less than 1% of the subsidy transfer this category is not shown in the chart. The chart is based on the data in the table above.
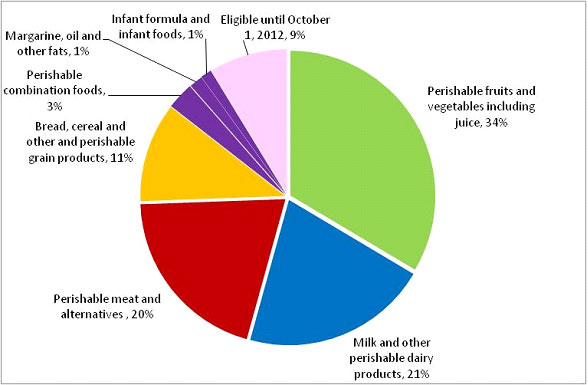
Description of this chart: Data by Product Category
The pie graph breaks down the total amount of subsidy spending between April 1, 2011 and September 30, 2011 by categories of eligible products as follows:
- Perishable fruits and vegetables including juice: 34%
- Milk and other perishable dairy products: 21%
- Perishable meat and alternatives: 20%
- Bread, cereal and other perishable grain products: 11%
- Perishable combination foods: 3%
- Margarine, oil and other fats: 1%
- Infant formula and infant foods: 1%
- Eligible until October 1, 2012: 9%
Last modified: 2012-08-09.
Data by province or territory and region
This table shows the amount of subsidy that was distributed by province or territory and region between April 1, 2011 and September 30, 2011, and the product quantities that were subsidized during this period. Within a province or territory, regions are listed in descending order based on the amount of subsidy; the region that received the highest amount of subsidy is listed first, followed by the region that received the second highest amount of subsidy, and so on.
| Region | $ subsidy | % total $ | kg | % total kg |
|---|---|---|---|---|
| Nunavut | ||||
| Baffin | 9,514,261 | 40% | 3,063,892 | 23% |
| Kivalliq | 2,621,061 | 11% | 1,761,355 | 13% |
| Kitikmeot | 1,887,775 | 8% | 1,029,607 | 8% |
| 14,023,097 | 59% | 5,854,854 | 44% | |
| Quebec | ||||
| Nunavik (Northern Quebec) | 5,888,526 | 25% | 2,533,474 | 19% |
| Quebec North Shore * | 2,176 | 0% | 1,088 | 0% |
| 5,890,7021 | 25% | 2,534,562 | 19% | |
| Northwest Territories | ||||
| Beaufort-Delta | 702,399 | 3% | 278,835 | 2% |
| Sahtu | 623,469 | 3% | 369,049 | 3% |
| Great Slave Lake | 2,220 | 0% | 44,404 | 0% |
| Deh Cho | 43 | 0% | 18 | 0% |
| 1,328,132 | 6% | 692,306 | 5% | |
| Manitoba | ||||
| 1,210,183 | 5% | 2,166,682 | 16% | |
| Ontario | ||||
| 804,471 | 3% | 1,571,152 | 12% | |
| Newfoundland and Labrador | ||||
| Labrador | 431,045 | 2% | 262,359 | 2% |
| Yukon | ||||
| 68,006 | 0% | 44,591 | 0% | |
| Saskatchewan | ||||
| 5,679 | 0% | 113,584 | 1% | |
| Total | 23,761,315 | 100% | 13,240,090 | 100% |
| * Quebec North Shore communities are eligible for a subsidy from Nutrition North Canada during the months when there is no marine service to these communities (generally from January to March). Note: Numbers may not add up due to rounding. Last modified: 2012-08-09. |
||||
Data by community
This table shows the amount of subsidy that was distributed by community between April 1, 2011 and September 30, 2011, and the product quantities that were subsidized during this period. Within a province or territory, communities are listed in descending order based on the amount of subsidy; the community that received the highest amount of subsidy is listed first, followed by the community that received the second highest amount of subsidy, and so on.
| Community | $ subsidy | % total $ | kg | % total kg |
|---|---|---|---|---|
| Nunavut | ||||
| Iqaluit | 2,393,288 | 10% | 1,506,715 | 11% |
| Pond Inlet | 1,654,547 | 7% | 232,719 | 2% |
| Igloolik | 834,873 | 4% | 233,100 | 2% |
| Arctic Bay | 833,285 | 4% | 111,004 | 1% |
| Clyde River | 717,302 | 3% | 138,966 | 1% |
| Cape Dorset | 711,347 | 3% | 195,859 | 1% |
| Pangnirtung | 706,991 | 3% | 217,926 | 2% |
| Rankin Inlet | 672,973 | 3% | 596,905 | 5% |
| Baker Lake | 638,725 | 3% | 369,388 | 3% |
| Gjoa Haven | 476,969 | 2% | 205,236 | 1% |
| Resolute | 449,272 | 2% | 48,490 | 0% |
| Repulse Bay | 438,036 | 2% | 137,398 | 1% |
| Kugaaruk | 385,716 | 2% | 128,131 | 1% |
| Taloyoak | 382,288 | 2% | 140,108 | 1% |
| Coral Harbour | 381,878 | 2% | 123,246 | 1% |
| Kugluktuk | 367,967 | 2% | 227,385 | 2% |
| Hall Beach | 342,957 | 1% | 93,764 | 1% |
| Qikiqtarjuaq | 278,918 | 1% | 86,363 | 1% |
| Cambridge Bay | 274,835 | 1% | 328,747 | 2% |
| Grise Fiord | 256,920 | 1% | 17,128 | 0% |
| Arviat | 252,327 | 1% | 394,142 | 3% |
| Kimmirut | 248,452 | 1% | 65,908 | 0% |
| Whale Cove | 125,779 | 1% | 70,480 | 1% |
| Chesterfield Inlet | 111,344 | 0% | 69,795 | 1% |
| Sanikiluaq | 86,110 | 0% | 115,951 | 1% |
| 14,023,097 | 59% | 5,854,854 | 44% | |
| Quebec | ||||
| Salluit | 991,198 | 4% | 238,743 | 2% |
| Kuujjuaq | 926,136 | 4% | 567,703 | 4% |
| Puvirnituq | 891,049 | 4% | 310,046 | 2% |
| Kangiqsujuaq | 522,305 | 2% | 124,458 | 1% |
| Inukjuak | 512,021 | 2% | 271,201 | 2% |
| Kangiqsualujjuaq | 422,305 | 2% | 146,780 | 1% |
| Kangirsuk | 396,853 | 2% | 100,565 | 1% |
| Akulivik | 322,662 | 1% | 90,698 | 1% |
| Quaqtaq | 274,492 | 1% | 60,923 | 0% |
| Ivujivik | 241,960 | 1% | 53,849 | 0% |
| Tasiujaq | 154,948 | 1% | 47,278 | 0% |
| Aupaluk | 114,487 | 0% | 31,690 | 0% |
| Kuujjuarapik | 61,383 | 0% | 407,313 | 3% |
| Umiujaq | 56,728 | 0% | 82,227 | 1% |
| Saint-Augustin / Pakuashipi * | 2,032 | 0% | 968 | 0% |
| Gethsémani (La Romaine) * | 144 | 0% | 120 | 0% |
| Blanc-Sablon * | 0 | n/a | 0 | n/a |
| Chevery * | 0 | n/a | 0 | n/a |
| Harrington Harbour * | 0 | n/a | 0 | n/a |
| Kegaska * | 0 | n/a | 0 | n/a |
| Lourdes-de-Blanc-Sablon * | 0 | n/a | 0 | n/a |
| La Tabatière * | 0 | n/a | 0 | n/a |
| Mutton Bay * | 0 | n/a | 0 | n/a |
| Tête-à-la-Baleine * | 0 | n/a | 0 | n/a |
| 5,890,702 | 25% | 2,534,562 | 19% | |
| Northwest Territories | ||||
| Ulukhaktok (Holman) | 288,623 | 1% | 83,136 | 1% |
| Norman Wells | 164,588 | 1% | 121,739 | 1% |
| Paulatuk | 141,426 | 1% | 42,327 | 0% |
| Fort Good Hope | 133,864 | 1% | 79,701 | 1% |
| Tuktoyaktuk | 130,888 | 1% | 85,251 | 1% |
| Tulita | 126,827 | 1% | 70,839 | 1% |
| Deline | 120,824 | 1% | 78,712 | 1% |
| Sachs Harbour | 93,541 | 0% | 18,119 | 0% |
| Colville Lake | 77,365 | 0% | 18,057 | 0% |
| Aklavik | 47,922 | 0% | 50,002 | 0% |
| Lutsel K'e | 2,216 | 0% | 44,314 | 0% |
| Trout Lake | 43 | 0% | 18 | 0% |
| Wha Ti | 5 | 0% | 91 | 0% |
| Gameti | 0 | n/a | 0 | n/a |
| 1,328,132 | 6% | 692,306 | 5% | |
| Manitoba | ||||
| St. Theresa Point | 263,238 | 1% | 383,953 | 3% |
| Island Lake (Garden Hill) | 240,542 | 1% | 335,895 | 3% |
| Oxford House | 179,437 | 1% | 332,654 | 3% |
| Waasagomach | 112,386 | 0% | 170,421 | 1% |
| Negginan (Poplar River) | 94,105 | 0% | 132,508 | 1% |
| Gods Lake Narrows | 77,032 | 0% | 197,959 | 1% |
| Little Grand Rapids | 72,229 | 0% | 111,921 | 1% |
| Lac Brochet | 67,774 | 0% | 93,860 | 1% |
| Red Sucker Lake | 60,343 | 0% | 89,172 | 1% |
| Gods River | 31,214 | 0% | 80,685 | 1% |
| Shamattawa | 7,601 | 0% | 152,020 | 1% |
| Berens River | 2,524 | 0% | 50,476 | 0% |
| Pauingassi | 1,758 | 0% | 35,159 | 0% |
| Bloodvein | 0 | n/a | 0 | n/a |
| 1,210,183 | 5% | 2,166,682 | 16% | |
| Ontario | ||||
| Attawapiskat | 210,749 | 1% | 303,825 | 2% |
| Kashechewan | 153,416 | 1% | 282,616 | 2% |
| Peawanuck | 128,445 | 1% | 67,278 | 1% |
| Fort Severn | 100,376 | 0% | 61,953 | 0% |
| Fort Albany | 71,462 | 0% | 123,651 | 1% |
| Big Trout Lake | 62,039 | 0% | 91,100 | 1% |
| Bearskin Lake | 34,003 | 0% | 65,740 | 0% |
| Muskrat Dam | 16,559 | 0% | 26,532 | 0% |
| Pikangikum | 8,711 | 0% | 174,226 | 1% |
| Kasabonika | 7,184 | 0% | 143,679 | 1% |
| Wunnummin Lake | 4,452 | 0% | 89,047 | 1% |
| Weagamow Lake | 3,643 | 0% | 72,851 | 1% |
| Sachigo Lake | 2,967 | 0% | 59,334 | 0% |
| Angling Lake | 253 | 0% | 5,063 | 0% |
| Kingfisher Lake | 212 | 0% | 4,244 | 0% |
| 804,471 | 3% | 1,571,152 | 12% | |
| Newfoundland and Labrador | ||||
| Nain | 252,935 | 1% | 94,899 | 1% |
| Natuashish | 82,382 | 0% | 71,059 | 1% |
| Hopedale | 37,006 | 0% | 39,616 | 0% |
| Makkovik | 18,610 | 0% | 25,117 | 0% |
| Rigolet | 16,225 | 0% | 15,310 | 0% |
| Black Tickle | 14,774 | 0% | 5,575 | 0% |
| Postville | 9,114 | 0% | 10,783 | 0% |
| 431,045 | 2% | 262,359 | 2% | |
| Yukon | ||||
| Old Crow | 68,006 | 0% | 44,591 | 0% |
| Saskatchewan | ||||
| Fond-du-Lac | 5,679 | 0% | 113,584 | 1% |
| Black Lake | 0 | n/a | 0 | n/a |
| Stony Rapids | 0 | n/a | 0 | n/a |
| 5,679 | 0% | 113,584 | 1% | |
| Total | 23,761,315 | 100% | 13,240,090 | 100% |
| * Quebec North Shore communities are eligible for a subsidy from Nutrition North Canada during the months when there is no marine service to these communities (generally from January to March). n/a = not applicable Note: Numbers may not add up due to rounding. Last modified: 2012-08-09. |
||||