Northern Food Retail Data Collection & Analysis by Enrg Research Group
Table of contents
Executive Summary
The purpose of this study is to provide an analysis of the northern Canadian grocery retail system and the environment that Nutrition North Canada (NNC) works within. In addition, the analysis considers how the delivery of the NNC program influences the northern grocery industry.
The focus of this study is grocery retailing across 103 northern communities currently eligible for either the full or partial NNC retail subsidy. Ten communities are singled out for more in-depth data collection and inquiry that is done through in-person visits into the communities. Profiles of the communities are provided as an annex to this report.
The total population of the 103 communities is approximately 93,700, based on the most recent census data available. This population is spread across over 4 million sq. kms. of Canada's North. Most communities contain less than 1,000 inhabitants.
The NNC program is structured to serve communities that lack year-round surface transportation (i.e. no permanent road, rail or marine access). By virtue, these communities are located in remote areas of Canada and a great distance from southern commercial centres where grocery resupply activities originate.
Within this environment, the retailing of groceries is a more expensive undertaking than is the same activity in the South. Northern grocery retailing costs are driven by:
- Transportation;
- Bricks and mortar - cost of maintaining stores in remote communities;
- Human resource considerations - Staffing is a challenge in the North with increased recruitment, training and salary costs;
- Spoilage (losses during transport or Best Before Date expiration) and/or shrinkage (theft). These occur at higher rates than in the South;
- Much higher inventory costs in the absence of 'just in time delivery’ resupply service which is commonplace in the South and
- Retailer profit margins.
The cost of groceries in NNC communities must be placed in the context of the economic situation of many of the local inhabitants. Employment opportunities are very limited. Most families live on single or fixed incomes supported mainly by government assistance.
Northern residents are actively seeking ways to minimize the cost of groceries in their communities. Those who reside in communities that have more affordable seasonal transportation service (winter roads or ferry) and some financial resources leave their communities to shop at a southern store.
Consumers unable to leave the community to shop may access the services of suppliers that will fulfill personal orders for northerners and transport orders directly into communities. The air freight distance in Nunavut and Nunavik makes this an expensive undertaking. This service is more broadly accessible in communities across the northern regions of Saskatchewan, Manitoba and Ontario.
A range of eligible and non-eligible grocery items are able to be purchased through personal orders. The availability of the NNC subsidy is an important measure to improve the affordability of this form of grocery shopping outside the community. Generally, northern residents are more likely to purchase perishable goods from sources within the community, because the local retailer appears better equipped to ensure quality control on perishable imports.
Local residents often turn to country food (wild game) to manage and budget their household grocery needs. However, there are challenges with the ongoing reliance on wild game to supplement northern diets. The desire among young residents (the 'next generation') to hunt wild game foods appears to be diminishing. In addition, the sustainability of wild game in the quantities necessary to support local communities is questionable, given the higher than average population growth rates.
The prospect of selling country foods in northern grocery stores is complicated by food safety regulations and transportation challenges.
Northern retailers understand that the cost of groceries presents a challenge to local residents of the communities in which they operate. From their perspective, they are continuously looking for ways to find efficiencies in the supply and operation of their stores.
The introduction of the NNC program has helped, because retailers are encouraged to seek out the most efficient means to transport non-NNC-eligible products, while supporting the transportation of perishable products. Stakeholders generally report that the program has resulted in NNC eligible products, particularly highly perishable items, are sold at a reduced price. However, many factors contribute to food security challenges in the North, and the NNC program cannot be called upon to alleviate all of those circumstances.
Observations and Recommendations
Food retailing in the North is the manifestation of an extremely complex supply chain, charged with delivering perishable products to widely distributed communities that are located in difficult terrain and challenging climate. This report provides a number of observations and recommendations to respond to the economics of providing perishable, nutritious food to the North.
Observations & Recommendations regarding the NNC Program
Observation 1: The overarching observation from this study is that food security and nutrition in the North is extremely variable and "one size may not fit all." Also, as suggested by one health care professional, the solutions to nutrition and food retailing challenges in the North are "intergenerational," and will take "decades." This individual meant it will take concerted efforts to expose school age children to healthy eating options from a 'southern' food or 'grocery store' food prospective.
Northern residents, like individuals from the South, learn many of their eating and cooking habits from their parents. In far northern communities, these efforts have to begin with school age children so this generation develops the skills to navigate the wide array of food options in a grocery store—and hopefully, navigate in a healthy manner. In the more remote communities, complex cooking-from-scratch skills are not yet common among certain segments of the population.
Observation 2: Many healthy eating and food preparation education programs are being offered in northern communities. Some of these are general in nature, while others are more focused on addressing specific health concerns such as diabetes.
Recommendation: Unquestionably, these educational programs and others like them provide valuable information and assistance to local residents regarding healthy eating and meal preparation. Based on interviews and observations, opportunities exist to inform people about the NNC program through these educational programs. Doing this would increase awareness of the NNC program among residents and, more importantly, connect visual references to the Program in retail outlets to tangible healthy eating/food preparation information communicated in the various activities mentioned previously.
Observation 3: In many respects, food retailing has improved. The selection of products has increased across almost all categories including frozen and fresh produce and the overall quality of grocery items has improved.
Recommendation: The definitions of products eligible for Level 1 or Level 2 NNC subsidies should be periodically revisited in the context of northern household purchase patterns that could be determined through discussions with retailers. Commodities that could facilitate healthy diets, but are not necessarily food items, could be discussed for inclusion in the Program.
Observation 4: From in-store visitation and from consumers' commentary, it appears the incidence of spoiled or past due products is decreasing. There is still work to do in this regard, but progress has been made. Food retailing in the North appears to be functioning reasonably in the face of many logistical challenges.
Observation 5: Awareness and understanding of the NNC program among the indigenous northern population is low. When informed of the presence of NNC, residents question the extent of the subsidy and whether it applies to their local retailer. Local residents and community leaders express concerns with transparency of the Program to consumers. In many communities, this concern about whether the subsidy is being fully applied by retailers is shared at the community leadership level, which ultimately does not help communication of important NNC program details down to local residents.
Recommendation: It is important that efforts to communicate the presence and structure of the NNC program continue and, if possible, increase in retail outlets. How the Program works and on what products it applies must be continuously communicated. It would also be beneficial to the Program if residents and local community leaders were provided a more complete picture of the range of factors that contribute to the high costs of groceries in the North.
Retailers should be encouraged to be open and forthcoming with local community leaders with respect to the operation of the NNC subsidy, and answer questions that do not jeopardize proprietary information. If 'buy in' from community leaders cannot be assured, it will be difficult to maximize the community benefits of the NNC program.
In subsequent analysis, it may be useful to test the hypothesis that residents in communities with low Level 2 subsidies ($0.05) or low Level 1 subsidies (< $2) are more likely to believe the NNC subsidy is not being passed on to the consumer, compared with residents in communities with higher subsidy rates.
Observation 6: The focus on selection and improving the quality of grocery products has placed a greater resource load on the supply chain to deliver groceries to these remote communities. The NNC retailer subsidy allows retailers to seek out the most efficient resupply options to stock their shelves.
Observation 7: As populations in parts of the North are growing faster than in southern Canada, and country foods have sustainability and acceptance challenges, the demand on NNC to assist in the price tag of the healthy food basket will continue to rise.
Recommendation: Consideration should be given to increase the funding of NNC to meet this demand. NNC should at least be indexed to inflation or to changes in costs that are major contributors to the cost of food retailing in the North.
Observation 8: The NNC program is lowering prices on NNC eligible products. In this respect, the Program is working. However, costs remain high. Is lowering prices enough for local residents who are managing their households on limited and fixed budgets? We believe the answer is "No." That said, NNC is part of the solution, but not the entire solution.
Recommendation: While the food retail system in the North appears to be working, and some would observe it to be improving, food costs remain extremely high. Those with limited incomes are struggling, and increased efforts must be made to narrow the gap between disposable incomes and the price of a healthy food basket.
Observation 9: Healthy food items such as fresh fruits, vegetables and dairy are almost universally acknowledged to be coming down in price. As these are examples of the Level 1 commodities targeted by the NNC subsidy, it appears NNC works; however, consumers do not make a direct connection to this being a result of the NNC subsidy. In some communities, particularly those served by only one grocery store, residents question whether the subsidy is being passed down to them in its entirety or at all.
Recommendation: While there is considerable communication material in the stores alerting consumers to the presence of the NNC subsidy, increased efforts in communications and awareness would be beneficial. An effort to increase and vary the approaches to communicating the Program to local residents would further their understanding of how the Program works and how consumers could adjust their grocery purchases to fully benefit from the subsidy.
Having NNC references relate more directly to local meal planning and preparation courses may also be useful in improving the awareness of the Program. Similarly, assisting retailers in communicating that transportation is only part of a very complex and expensive supply chain could serve to improve NNC's awareness and provide context around the 'impact' of the subsidy.
Finally, retailers should continue and, if possible, increase their support of the educational activities of healthcare professionals in local communities in regards to nutritional eating.
Additional Observations & Recommendations beyond the scope of NNC
Observation 10: Operational costs for retail outlets are much higher in the North compared to similar operations in the South. In particular, electricity costs are a significant contributor to the total costs of operation.The kwh rates in the North can be five to ten times greater than in the South.
Recommendation: More could be done to reduce costs in the North. Alternate energy sources should be researched in order to offset or at least supplement the expensive diesel generator-powered electricity sources. Wind, hydrogen and even solar power could be considered.
Recommendation: While sea lift is relatively inexpensive in comparison to air resupply, it is still very expensive, largely because of the absence of adequate port facilities in many northern communities. Efforts should be made to develop and improve port facilities in the North. Doing so would reduce or eliminate the need for marine carriers to bring barges and tugs on board the resupply vessels to facilitate offloading.
Observation 11: Country foods are an important food source for many Northerners. They are popular and frequently consumed where available but there are questions regarding the long-term sustainability of this food source. In addition, cultural shifts are taking place in the North, with the younger generations showing signs of being less interested in living off the land than their ancestors. A decline in country food consumption will place greater reliance on the grocery retailer to supply the community's food needs.
Recommendation: Country food theoretically has the potential to reduce the demand for food being brought from the South. As such, the use of country foods should be encouraged where feasible. However, this course of action faces challenges in terms of sustainability and acceptance from future generations. Some researchers have proposed looking at the "Greenland model" where country foods go straight to local markets. There may be some very valid reasons why such an approach would not be appropriate for northern Canada, but research into that model may be worthwhile.
Observation 12: Shopping outside of the community store, whether via phone or internet order shipped into the community or consumers travelling to shop outside the community and bringing goods back into the community is a common activity in almost all northern communities. The extent of this varies depending on transportation availability and access to credit by consumers in the community. Local retailers are fully aware of the use of shopping alternatives to the local store but at this point do not feel it has a significant impact on their business activity.
One possible unintended consequence of the shift from Food Mail Program to NNC may be an increase in physically shopping outside the community. During this study some individuals suggested that in the past, shoppers got quite adept at bringing a wide variety of commodities into the community through the Food Mail Program. With its narrower list of eligible commodities, NNC may have prompted a number of the shoppers to move to physically shopping outside the community for items not covered by the NNC subsidy. As one resident indicated, "I'm no longer allowed to go through Food Mail. That is why I go to Wal-Mart."
Observation 13: Anecdotally, residents raise concerns that groceries are more expensive and service levels lower in communities served by one grocery store. While residents in a community served by only one grocery store may advocate strongly for the need for a second grocery retailer to "keep the other guy honest," the concerns regarding pricing appear no less intense in the community served by multiple grocery outlets. The challenge of prices is not one solved by increased competition. In fact, the high fixed costs of operating in the North may contribute to higher prices if too many retailers chase a small and isolated market.
Objective of Study
Nutrition North Canada (NNC), within Aboriginal Affairs and Northern Development Canada (AANDC), tendered a request for research services to provide an overview of the nature of grocery retailing in isolated northern communities and specifically, an examination of the retail situation in the 103 communities served by the Nutrition North Canada Program.
The Statement of Work requires a comprehensive review of:
- The types of retail operations;
- The demographics of the markets in which such retailers operate;
- The nature of competitive forces in northern food markets; and
- The contribution of food retail outlets to the local economy (e.g., employment, community infrastructure and economic development).
The Statement of Work also included a request to review an earlier study The Food Retailing Structure of the Northwest Territories conducted by D. H. Green, and M. B. Green, in 1986 and to provide comparisons to current retailing conditions . It should be noted, the 1986 study was limited to the area that is now the Northwest Territories (NT) and Nunavut (NU), whereas this study addresses the entire NNC program area. In addition, retailing operations discussed in the 1986 study included communities with year round surface transportation access, whereas the NNC communities face more complex and challenging access.
Methodology
This study involves a number of different data collection methodologies. This section provides a brief outline of the various methodologies employed in this study. A more detailed examination of the methodology and source data is included in Appendix 2.
Primary Data Sources
Online Survey with Grocery Store Managers
NRG conducted an online survey with a sampling of grocery store retail managers. All grocery retailers in NNC-eligible communities that could be identified (approximately 131) were contacted to conduct an online survey. The online survey with store managers achieved a participation rate of approximately 75%.
One-On-One In-Depth Interviews
In-depth interviews were held with senior officials from the Northern Store, Arctic Co-op, Stanton's and the Fédération des cooperatives du Nouveau-Québec (FCNQ), as well as several companies active in supplying personal orders. Representatives from several airlines that provide air freight services into the North were also interviewed.
Community Case Studies
NRG Researchers visited 10 communities and conducted in-person interviews and store visits, spending a minimum of 2 to 4 days in each community gathering data.
Though a cluster analysis approach and further refinement through discussion with NNC staff, the following communities were identified for the community profile phase:
| Province/Territory | Community |
|---|---|
| Northwest Territories (NT) | Aklavik |
| Nunavut (NU) | Iqaluit; Arviat; Igloolik |
| Manitoba (MB) | Garden Hill; Lac Brochet |
| Ontario (ON) | Fort Severn |
| Quebec (QC) | Puvirnituq; Quaqtaq |
| Newfoundland and Labrador (NL) | Rigolet |
In each community, individuals or groups targeted for interviews included the following:
- Focus groups among a sample of local consumersFootnote 1, and
- In-person discussions with stakeholders in the community, particularly those involved in food retail, local government, community economic development, education and health services.
Secondary Data Sources
Prior to starting interviews, NRG Researchers conducted a literature review of existing research. An Excel database was built that was subsequently updated with demographic, socio-economic, community infrastructure, transportation and retail infrastructure data. This was compiled for each NNC-eligible community.
The NNC Program and the Northern Retail Environment
The NNC Program
The Government of Canada introduced the NNC program on April 1, 2011. The Program is a retailer-based subsidy that is designed to reduce the cost to northern consumers of perishable, nutritious food. NNC replaced the Food Mail Program which was a direct transportation subsidy administered by Canada Post. Including both the Aboriginal Affairs and Northern Development Canada (AANDC) and Health Canada portions, the NNC program currently operates within a set annual budget of $60 million.
NNC supports the shipment, sale, and consumption of perishable, nutritious food in 103 isolated communities across northern Saskatchewan, Manitoba, Ontario, Quebec and Labrador, as well as eligible communities in Northwest Territories, YukonFootnote 2 and Nunavut. Perishable foods can be fresh, frozen, refrigerated or have a shelf life of less than one year. NNC-eligible foods must be shipped by air.
To be eligible for the subsidy, communities must lack year-round surface transportation (i.e., no permanent road, rail or marine access). In addition, the community must have participated in the previous Food Mail Program.
Under NNC, a subsidy is paid directly to registered northern retailers and southern suppliers based on the actual weight of eligible foods shipped to these 103 northern communities. The suppliers and retailers participating in the Program are northern retailers and southern wholesalers and suppliers who have signed contribution agreements with AANDC agreeing to certain conditions of accountability and transparency established by NNC. Furthermore, the Program participants are required to pass along the full subsidy to their customers.
Some commercial and social institutions in eligible communities are also eligible for the subsidy, as are individuals who obtain their food through personal or direct orders to registered southern suppliers. Unlike with the Food Mail Program, under NNC, northern retailers and southern suppliers are required to make their own arrangements with the airlines servicing the North.
The subsidy is paid directly to the retailer based on administrative information (invoices, waybills, etc.) submitted to the government for subsidy reimbursement. Consumers are able to see their community's subsidy per kilogram rate on the bottom of each cash register receipt, and the subsidy reduction must be made visible on their invoice if ordering directly from a southern supplier.
NNC Service Area Profile
The 103 NNC-eligible communities collectively contain an approximate total population of 93,700, based on available Statistics Canada 2011 Census data (or other sources where available).
The NNC-eligible population (93,700) is located in small communities across approximately 4.3 million sq. kilometres. The largest NNC-eligible communities are Iqaluit, NU with a population of 6,699, followed by the Manitoba Island Lakes communities of St. Theresa Point (2,871) and Garden Hill (2,776), and Rankin Inlet, NU with a population of 2,577 (according to the latest census data). The smallest NNC communities are Trout Lake, NT(92) and Sachs Harbour, NT(112).
The population of the NNC region may be small, but it is growing. Between 2006 and 2011, the population growth rate in areas containing eligible communities was 6.2% versus 5.9% nationally (Census 2006, 2011). The compounded annual rate for the same communities is approximately 1.21% in comparison to the national rate of 1.15%. Nunavut and Nunavik, which account for 80% of the entire weight of foods subsidized, have higher rates of population growth at 1.5% and 2.3% per year, respectively.
In the Green report, Food Retailing Structure in the Northwest Territories, prepared in 1986, the population of the study region (before the division of the Northwest Territories to create Nunavut) was estimated to be 50,000. Today the population of the same region (NT and NU) is 73,370 according to 2011 census data — a 46% increase.
Of the total population in the NNC-eligible area, it is estimated that 90% identify as Aboriginal, according to the 2011 Household Survey.
All 103 communities lack year-round road, rail or marine access, which is one of the criteria for program eligibility. They are served by air transportation year-round, and at various times of year the communities have either winter ice road access or are able to receive resupply visits by ships, ferries or barges. Of the 103 communities, about 44 are served by road (mainly winter). These communities are mainly in the northern regions of Manitoba, Saskatchewan or Ontario. Sealift serves about 50 communities. These communities are mainly in Nunavut, although Nunavik, Northwest Territories and the Labrador coast also are served by this mode in the ice-free season. Ferry service (Labrador) also supplements resupply for some communities, bringing the number of communities with water resupply to about 60. A handful of communities (4) mainly in northern Northwest Territories appear to be served by ice roads and then by barge lift in the ice-free season.
Other traits are summarized in the following table. About one-half (48 of 103) are communities with only a single food source retailer. Air service is variable, with 56 of the 103 communities receiving air service at least 4 times per week. Most communities' runways are less than 3550 feet in length, and very few are paved.
| Attribute | Attribute | # of Communities | |
|---|---|---|---|
| Total Northern population | 229,822 | Avg. Runway Length | |
| Total pop. NNC-eligible (103) | 93,700 | <2300 ft. | 6 out of 103 |
| Single retailer community | 48 out 103 | 2300 ft. – 3550 ft. | 51 out 103 |
| Transportation Access | 3551 ft. to 4999 ft. | 25 out of 103 | |
| NNC Comm.'s served by Ship/Ferry | 60 out of 103 | >5,000 ft. | 7 out of 103 |
| NNC Comm.'s served by Winter Road | 50 out of 103 | Runway Composition | |
| Air Service Frequency | Paved, asphalt | 8 out of 103 | |
| Air service 4 or more times a week | 56 out of 103 | Gravel, crushed rock, dirt | 90 out of 103 |
| Airport not in communityFootnote 3 | 5 out 103 |
Northern Retailing Overview
131 grocery retail stores were identified as operating in the NNC-eligible communities. It should be noted that this number may be a slightly low approximation as some independent stores are quite small and difficult to identify through conventional sources.
Retailers operating in the North may be categorized several ways. NNC categorizes them based on their corporate structure, as follows:
- Private corporation (The North West Company (NWC)) – 67 Northern or NorthMart stores
- Co-operatives (Arctic Co-op Limited (ACL); La Federation des Co-operatives du Nouveau Quebec (FCNQ) and Stanton's) – 46 stores
- Independents – 18 stores
They may also be categorized by size:
- Two major retail chains (NWC and ACL), accounting for 97 stores
- 19 regional chains (Stanton's (2), FCNQ (14) and Big Land Grocery (3) across Northwest Territories, Quebec (Nunavik) and Labrador respectively
- Approximately 15 sole proprietor independent grocers
The NWC also operates nine convenience style stores under the QuickStop banner in NNC-eligible communities. These communities are:
- Nunavut – Pangnirtung, Iqaluit, Rankin Inlet, Arviat, Baker Lake, Cambridge Bay and Kugluktuk
- Northern Ontario – Attawapiskat and Pikangikum
A short summary of each of the retailers in NNC-eligible communities follows.
The North West Company
The North West Company has a long history of operating in Canada's north tracing back to 1668. Some communities have had a store presence for over 200 years. The North West Company's stores offer a broad range of products and services with an emphasis on food.
The North West Company also operates grocery retailing operations in remote communities in Alaska (AC Value) as well as on islands in the Caribbean and the South Pacific (Cost-U-Less). The company also operates 31 Giant Tiger stores across western Canada. The Giant Tiger brand is a general merchandise store in terms of product mix, compared to the other retail operations. The North West Company's mission is to be a trusted community store.
In Canada's north, the company currently operates under three banners (The Northern Store, NorthMart and Quick Stop convenience stores). The majority of its operations are branded under the Northern Store (122 stores in total, 68 which are located in NNC-eligible communities). North West Company operates six stores under the NorthMart brand of which one, located in Iqaluit, is in an NNC-eligible community. The NorthMart stores are larger retail operations with more additional non-grocery related amenities typically provided. Finally, there are 17 QuickStop convenience stores that typically operate in larger communities and serve as a second outlet to an existing North West Company store.
In total, between Northern Stores, NorthMart and QuickStop stores, the North West Company operates approximately 724,000 of retail sq. ft. across northern Canada. The average Northern Store size (retail space) is slightly less than 5,700 sq. ft., but this does vary considerably between communities. In addition to the provision of grocery food products, Northern Stores provide an array on non-grocery related product services such as financial services, tax preparation, general merchandise and clothing.
The North West Company's head office and primary hub of its northern Canadian retail operations is in Winnipeg, where it maintains a 248,000 sq. ft. warehouse for its inventory and distribution activities. Some northern resupply activity also occurs out of Edmonton, Ottawa and Montreal. The North West Company employs approximately 3,000 people as part of its Northern Store/NorthMart store network, with the vast majority of these individuals being residents from the local northern communities.
The North West Company, through its Northern and NorthMart stores, is a registered retail participant in the NNC program.
Arctic Co-operatives Limited
The Arctic Co-operatives Limited was officially founded in 1972 and amalgamated as an entity in 1982. However, its Co-operative roots date back to the 1950s in Canada's north. It is part of the broader Co-op community that operates across Canada. The Arctic Co-op operates a total of 32 stores in Canada's north, mostly under the Arctic Co-op banner and one identified as Arctic Ventures Marketplace (a recent acquisition in Iqaluit). Of Arctic Co-op's 32 stores, 30 are located in NNC-eligible communities.
In addition to retailing groceries in communities across the North, the Co-ops provide hotel services (Inns North), cable operations, fuel services, taxis, construction, outfitting, arts and crafts production and property rentals. All these activities—grocery and non-grocery—result in Arctic Co-op being an important service provider in the communities where it operates.
The central role of Arctic Co-op is to co-ordinate the resources and combined purchasing power of the local Co-operatives in a manner that will enable them to provide operational and technical support services to their members in an economically viable manner.
The mission of Arctic Co-operatives Limited is to be the vehicle for service to, and co-operation among, the multi-purpose co-operative businesses in Canada's north, by providing leadership and expertise to develop and safeguard the ownership participation of Member Owners in the business and commerce of their territory.
Structurally, each community where an Arctic Co-op operates is its own community owned Co-operative. Residents of the community join the Co-operative as members and are able to share in the profits of the store at the end of the year. There are some advantages to this model from a community standpoint. However, the more community-based decision format can also present challenges in terms of generating consistent system-wide outcomes.
The company's central office and hub of distribution operations is in Winnipeg. All of Arctic Co-op's stores are located in Northwest Territories and Nunavut. It employs approximately 1,000 people, with most residing in remote northern communities.
The Co-op is a registered retail participant in the NNC program.
Fédération des Coopératives du Nouveau Québec
La Fédération des Coopératives du Nouveau Québec (FCNQ) is a grocery retailing Co-operative that operates solely in the Nunavik region of northern Quebec. It consists of 14 stores, all of which are located in NNC-eligible communities. The FCNQ was incorporated in 1967. The mission of the Co-operative is provided below.
The purpose of the Co-op movement is to get its members to work on their own development through social and economic activities that are financially sustainable. The purpose of the Federation is to support the affiliated Co-ops in their efforts to work on their own development.
The Co-op is involved in more than just grocery retailing. Its other activities in communities include:
- Banking, post offices, cable TV and Internet services
- Management training, staff development and auditing service
- Marketing Inuit art across Canada and around the world
- Operating hotels, a travel agency, and hunting and fishing camps
- Bulk storage and distribution of crucial oil & fuel supplies
- Construction projects in Nunavik for housing, schools, etc.
The Co-operative movement is the largest non-government employer in Nunavik, with over 260 full-time and 50 seasonal employees in the region and 120 full-time employees in Montreal. The FCNQ central office is located in Montreal.
The FCNQ is a registered retail participant in the NNC program.
Stanton Group Limited
The Stanton Group Ltd. is an Inuit-owned organization and is a registered retail participant of the NNC program. Its central base of operations is out Inuvik, NT. Its grocery retailing operation consists of 3 stores—located in Inuvik, Aklavik and Tuktoyaktuk. The latter two are NNC-eligible communities.
The Inuvialuit Development Corporation, owner of the Stanton Group, is a diversified investment, venture capital and management holding company, wholly owned by the Inuvialuit Regional Corporation. The organization's goal is to have full Inuvialuit participation in the northern Canadian economy and integration into Canadian society through development of an adequate level of economic self-reliance and a solid economic base. The Inuvialuit Development Corporation was incorporated in 1977 and is one hundred percent Inuvialuit owned.
Its grocery operations in Northwest Territories consist of the following facilities:
- 15,000 square foot warehouse in Inuvik;
- 7,000 square foot retail space in Inuvik;
- 2 outlying retail outlets - Tuktoyaktuk, Aklavik; and
- Full line of delivery vehicles in addition to a logistical coordination center in Inuvik.
The Inuvialuit Development Corporation is also diversified and has operating interests in two Northwest Territories airlines. Aklak Air offers scheduled and chartered passenger and freight service across the western Arctic. Canadian North is an airline owned equally by the Inuvialuit of the Western Arctic and the Inuit of Nunavut.
Its hubs of operations are in Edmonton and Yellowknife in terms of accessing grocery products from the South.
Big Land Grocery
Big Land Grocery, with three stores, is owned by the Labrador Development Corporation. Big Land Grocery operates stores in the Labrador communities of Hopevale, Nain and Makkovik, all of which are NNC-eligible communities. Big Land Grocery is a registered retail participant in the NNC program.
Outshopping
For the purpose this study, outshopping is defined as purchasing items outside of the local physical store. This includes individuals travelling outside of the community to neighbouring towns on winter roads, ferries or air. It also includes purchasing items from the internet or phone and having it delivered via barge, truck, ferry or air. Outshopping also includes purchasing goods from suppliers that come into the community to sell their items.
NNC Direct / Personal Order Suppliers
Residents in the North have the opportunity to order items from among 18 NNC registered southern suppliers. Individuals ("personal orders"), social institutions (e.g., schools, daycares) commercial establishments and even small retailers (e.g., hotels, restaurants) are able to place direct orders with their chosen supplier and transport the order to their community. These NNC registered southern suppliers sell both subsidized and non-subsidized items. Some companies, in addition to basic groceries, specialize in the provision of particular products such as organic foods or meat packs to customers. NNC registered suppliers are required to pass on the subsidy on all items that are identified on the NNC list of Subsidized Foods. When NNC-eligible products are ordered, the savings is calculated for the weight of the subsidized items and indicated on the customer's invoice.
Direct order supplier businesses are set up in several different ways in terms of their structure and operations. Most registered direct order companies are located in a southern city or town (at least far enough south for all weather road access). One company was identified as having a satellite office in the Kivalliq region of Nunavut. The purpose of the office was said to have been established to better assist its customers.
Some companies operate like grocery distributors with fairly large warehouse space, coolers and freezers. These organizations have sophisticated order assembly and packing areas. A few companies visited as part of this study (Arctic Buying Company, Harris Meats) maintained from 9 to 15 staff, depending on the level of activity.
Other companies are much smaller in nature and typically associated with a larger traditional grocery retailing operation. The personal order business is an offshoot of the grocery store activity. Typically, the direct order part of the business has space at the rear of the store and relies on the logistics of the main grocery retail operation to support the direct order requirements.
Some suppliers are almost exclusively serving individual customers while others are involved in supplying commercial customers (restaurants, hotels, outfitters), corporate customers (mining camps) and government events (conferences). It should be noted that hotels, restaurants and social institutions such as day cares are eligible to access the NNC subsidy, but commercial organizations, such as mining operations, and government agencies are not eligible for the NNC subsidy. A list of recipients that are not eligible to claim the subsidy is listed on the Nutrition North Canada program website.
In interviews conducted with several suppliers, it was reported that for Nunavut and Nunavik the most frequent individual customer tended to be a transplanted southerner working in the North. In northern Manitoba and Ontario, however, this was less likely to be the case, as indigenous locals and transplants were equally likely to be using the services of a personal order supplier.
Based on interviews, and from evidence gathered in actual communities, most order companies have particular regions of focus. This focus is in part influenced by transportation logistics and the ability to find efficiencies in routing, trans-shipping and favourable freight contracts for some communities. Additionally, some companies may focus on certain areas because the business owners may have community connections which facilitate a good working relationship with particular customers.
The more active direct order companies negotiate freight rates with air carriers to transport their goods to the North. Other firms simply pass this cost to the customer. Some companies also organize large orders (crates) for customers that are barged in during the annual summer resupply period, although these shipments or orders would not be eligible for the NNC subsidy, which can only be applied to eligible items transported by air.
While NNC collects data on the weight of eligible items subsidized under NNC's direct order provision, it is not possible to accurately develop a picture of how large the direct order business is in terms of volume of groceries being sold into the North outside of NNC. One airline active in northern freight transportation estimated that they currently transport approximately 10 million lbs of personal order freight annually into northern Manitoba. The company added that this volume of business is down from over 11 million lbs about 5 years ago. The decline was attributed to the change to a narrower list of food products eligible for a subsidy following the transition from the Food Mail Program to NNC. As noted earlier in this report, local residents appear to be resorting to more shopping physically outside the community as opposed to flying on direct orders.
Cost Drivers of Retailing Groceries in the North
Transportation
Transportation is a significant factor that influences the differential in the price of groceries between northern and southern retail outlets.
One key element is that, unlike most southern grocery retailers, stores operating in the North are responsible for the transportation of their product and merchandise to their store. In the South, the supplier assumes the cost of transporting their product to the retailer for sale. Not only is transportation to northern store locations costly, it is also an additional direct cost borne by northern store locations, whereas it is not generally a cost line item exposed to management of southern retail operations.
Major northern retail chains must also provide the necessary supporting infrastructure to efficiently accomplish this task because they are responsible for the transportation to their network. This involves significant warehousing in southern locations to receive goods from suppliers, organize them and ship them out to various points for distribution in the North. For example, the North West Company maintains a 248,000 sq. ft. warehouse complex in Winnipeg. There are costs associated with maintaining this infrastructure, in addition to the actual costs associated with handling and moving the product from the warehouse to store, a discussion of which follows.
Several factors increase the cost of freight movement. These are the mode of transportation, the distance travelled and the number of times the freight is handled or 'touched' along the way. The actual number of times an item is handled in a cross-dock or trans-shipping process may be a greater factor in increasing costs than is the actual distance travelled. On a tonne-kilometre basis, ocean freight is the least expensive freight transportation mode, whereas air freight is the most expensive.
For acceptance under the NNC program, communities must lack year-round surface transportation (i.e., no permanent road, rail or marine access). In all 103 NNC-eligible communities, air transportation is critical to the ongoing resupply of groceries, particularly for perishable items such as produce, meats and dairy.
An annual resupply is typically conducted, either in the ice-free period in the summer when barges and ferries are able to transport goods to a community, or in the winter months when a winter (ice) road can be constructed and operated. These seasonal resupplies are mainly used to move bulky, heavy or non-perishable items. As such, the NNC subsidy is not applicable.
Whether by air freight, ship, barge, or trucking, it is more expensive to transport goods to a remote northern community. Retailers themselves or the organizations they belong to—North West Company or Co-ops — are cautious about sharing precise freight costs for transporting goods to their stores for competitive reasons, but from the various interviews conducted over the course of the study some information regarding the costs of shipping to an isolated northern environment is provided in the following sections. In addition, where possible, comparisons to shipping in a southern environment are provided for contextual purposes.
Air Freight
A senior Perimeter Air staff member who is active in shipping freight into northern Manitoba communities, including many NNC-eligible communities, estimated that the cost is approximately 30% higher than shipping freight a comparable distance in the South. Calm Air, another prominent northern airline, did not provide an actual percentage, but firmly agreed that transporting freight to the North was comparatively more expensive than freighting within the South. Calm Air is active in flying out of Winnipeg servicing routes in Nunavut.
Reasons provided by the air carriers as to why it costs more to move freight by air in the North compared to the same distance in the South are provided below:
- Staffing: The pilots flying northern routes are paid more – close to 20% in some cases. As well, ground crews are required in northern locations to be paid at a higher rate than a comparable position in the South. Calm Air maintains its head office in Thompson, Manitoba. As a result, the company pays more for staffing certain positions in its Thompson operations.
- Fuel: Fuel is more expensive in the North. Planes almost always have to refuel in the North for the southbound return trip. This is due to the great distances travelled and/or the decision not to carry excess fuel in order to facilitate greater freight capacity. The fuel stored in various remote communities is trucked in on winter roads or barged in, and is therefore more expensive than fuel staged in the South. In addition, the fuel must be purchased well in advance of consumption and stored in significant quantities at the airports.
- Airport infrastructure maintained by airlines in the North: Infrastructure is more costly to build and maintain in the North. Also, timelines for building infrastructure in the North can be two or three times longer than in the South, which delays its revenue-generating capacity.
- Runways: The length of the runways and their predominantly gravel construction increases the operating costs for airlines flying these routes. Most runways in the NNC-eligible communities are approximately 3500 ft. in length. This is shorter than most runways in the South and a shorter runway requires additional braking when landing, increasing the frequency of brake maintenance. For most large turbo prop or jet aircraft, the gravel runways also necessitate the installation of gravel landing kit. Gravel kits cost between $700,000 to $1 million to purchase and install.
A final observation about the costs associated with air resupply is that there was no ability, from an air service perspective, to achieve any economies of scale as is possible in southern markets. This is primarily due to:
- Small populations in the communities being served;
- Limited runway lengths; and
- Low load factor potential for flights with origin/destination pairs within the North.
Apart from Iqaluit, which has the population base and the location to serve as a hub for points further north, the planes serving NNC communities are smaller turboprop aircraft, often in a combination passenger and freighter configuration (Combi). The volume of perishable freight required in these communities is relatively small, and the Combi configuration is efficient due to its flexibility. On any given flight, the number of passengers and freight load can be quite variable. By having flexible bulkheads, the passenger cabin can be relatively quickly reconfigured to maximize the use of cabin space, allowing for sufficient seating for passengers while simultaneously maximizing floor space for cargo (bulk or palletized). Essentially, the Combi configuration allows each flight to be customized to meet the needs of the flight's passenger and freight load. In some airframes, movement of the bulkhead and adding or removing seats can be readily accomplished in a matter of hours.
However, while efficient on a flight-specific basis, as a fleet-wide modification, the Combi is not as cost-effective as larger freight-only aircraft operating in conjunction with passenger aircraft with belly cargo. The reality is that load factors and freight demand in the North's thin markets do not warrant this more cost-effective fleet make-up.
There are few circumstances where northern communities can take advantage of the most efficient fleet configuration. Iqaluit, as a major northern hub, utilizes B737 Combi aircraft in links with the South. Iqaluit is also served by an all-freight B767. The typical Iqaluit-Ottawa route uses either a passenger B737 or a B737 Combi, depending on the passenger load requirements. Iqaluit has a high government presence at both the territorial and federal level, contributing to a frequent need for a passenger-configured B737. In such instances, freight, including food items for northern communities, is held back for the next flight. In thin, uneven markets, passenger travel and air freight can often be in a competitive situation, and freight always loses that competition.
Trucking - Winter Roads
Another critical resupply method for the NNC-eligible communities is the seasonal opportunity of winter roads or ice roads. Winter roads are particularly important for the resupply of NNC-eligible communities located in the northern regions of Saskatchewan, Manitoba and Ontario and a few locations in the North West Territories.
The ice road season is the primary resupply time for the store's non-perishable grocery and non-food household items—canned goods, packaged dry goods, bottled beverages, paper products and cleaning supplies for example.
The goal of the seasonal resupply for remote stores is to bring in enough stock to last the store until the next season resupply period (up to 12 months). In reality, this is not always possible because some grocery items have suggested Best Before Dates (BBD) that limit the time they are saleable.
As with air freight, this research provides evidence that resupply into remote northern communities by winter road is more expensive than a similar trucking resupply effort between southern locations. Based on retailer and local government interviews, rate differentials can be quite significant depending on the location being served. The following are some examples of differing freight charges:
- Winnipeg to Edmonton, AB – approx. $1,200 (1350 kms)
- Winnipeg to Thompson, MB – approx. $3,500 (770 kms)
- Winnipeg to Garden Hill, MB – approx. $6,520 (1070 kms of which 300 kms winter road)
- Winnipeg to Fort Severn, ON – approx. $16,000 (1700 kms of which 700 kms are winter road)
The previous examples, in particular the freight charges for Winnipeg to Edmonton (two southern locales) versus going north, demonstrate the increased hauling charges. The reasons for the higher northern hauling charges are:
- The inability to pick up a return or backhaul once reaching the final destination in the North. In the first example in the previous list, it would be normal for the truck, once reaching Edmonton, to pick up another load and haul that to a destination out of Edmonton. This is a rarity for northern hauls, so the truck must return to its original southern destination empty and at a cost to the original vendor.
- The pay for truckers travelling winter roads is higher than truckers on all weather roads, in order to account for risks with winter road trucking. Mishaps are infrequent, but they do occur and can be severe, given the remoteness of the areas travelled. In addition, due to safety reasons, truckers travelling on winter roads are only allowed to travel between 20 to 30 KM/hr. This lengthens the duration of trips considerably and adds to the cost.
- Refueling during long winter road trips (i.e., Fort Severn) is more costly compared to long southern all weather road trips. On long winter road trips, it is common for trucks to travel in a convoy with several trucks hauling fuel. This provides a fuel source along the trip, as well as fuel support in case of mechanical breakdowns or mishaps. The need to travel with extra trucks with the sole purpose of carrying fuel for the convoy is rare in the South, and is another example of expensive accommodations that need to be made for northern resupply.
- Based on interviews, some winter roads can be very rough and, as a result, hard on trucks and trailers. This causes increased maintenance activity that, while borne by the trucking company, is assumed by retailers to be built into the winter road hauling freight rate.
Even with the increased costs illustrated previously, retailers still say that trucking is one of the most affordable means of resupplying a store on a per pound basis. Typically, a store requires three to five semi trailer deliveries of grocery and merchandise items to supply their needs beyond the end of the winter road season.
Ship, Barge – Sealift
Resupply in the summer months (July – September) by boat is critically important for NNC-eligible communities located in Nunavut, Northern Quebec (Nunavik), parts of Northwest Territories and Labrador. As with winter roads, this is an opportunity for retail stores in these communities to stock up their warehouse with durable goods that should, for the most part, last through to next year's resupply period (again subject to BBD issues). Marine resupply is more affordable than via air cargo.
Some factors make marine supply more expensive in the North than between ports located in southern communities. The staging or loading of the ships is a more involved and complicated process in the North. Usually the ships are making multiple ports of call on a trip, so freight has to be loaded in a manner that can be efficiently accessed in the order of communities visited. Complicating the loading of resupply orders for retail stores, a considerable amount of personal orders and non-grocery supplies are included for the community.
Another cost driver of the summer marine resupply process is associated with inconsistent (or absent) harbour and docking facilities. Some communities, for example many in Nunavik, have reasonably good docking facilities with relatively efficient unloading. However, other communities served via ship, particularly those further north, are located in areas where the ocean floor offshore drops off very gradually. There are few natural harbours further north meaning, in conjunction with extreme tides, the sealift must operate mostly without port infrastructure in the traditional sense.
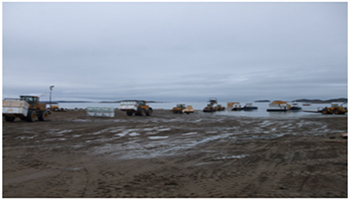
A common but complex approach is the use of lightering tugs and barges. The ocean-going sealift vessel anchors offshore and items are offloaded onto barges alongside the sealift vessel. Lightering tugs then push the barges to shore and ramps are laid down, allowing front-end loaders to remove the freight for on-shore warehousing. The following are a number of images that describe the process. It should be reinforced that this complex and time-consuming procedure is not required at ports with well-established infrastructure.

Off-loading Barges and Lightering Tugs
Source: Desgagnés Transarctik Inc.

Lightering Tug moving Barge to Shore
Source: Desgagnés Transarctik Inc.
Unloading Barges on Iqaluit Shoreline
Source: Desgagnés Transarctik Inc.
Barge handling is a lengthy process that is sometimes delayed due to difficult weather conditions. This adds costs that are reflected in the shipping rates. As stated earlier, marine is considered the least expensive freight mode on a tonne-kilometre basis. However, as was also pointed out, trans-shipping (transferring goods from one transportation mode to another) contributes dramatically to costs along the supply chain. While sealift is still the most cost-effective mode, the adaptations required to make sealift work in the North cut deeply into the cost savings inherent in that mode.
While climate change may have increased the number of sealift cycles within a season, there are downsides. It has been reported that shorelines and freight lay down areas have become softer, resulting in greater offloading challenges, and the increased tendency to "sink a loader" in the mud.
Distance to Market
Regardless of transportation mode, another factor that can increase transportation costs is the distance the freight must travel from source to market.
If one were to take the centrally located city of Winnipeg, MB as a starting point (also home to head offices of the North West Company and Arctic Co-op which together operate 95 stores in NNC-eligible communities), this would be the distance from it to reach the northern markets.
Arctic Co-op Limited
- Winnipeg to Arviat, NU(closest) - 1,340 kms
- Winnipeg to Rankin Inlet, NU - 2,465 kms
- Winnipeg to Grise Fiord, NU (furthest) - 3,020 kms
North West Company
- Winnipeg to Little Grand Rapids, MB (closest) - 275 kms
- Winnipeg to Iqaluit, NU - 2,300 kms
- Winnipeg to Norman Wells, NT- 2,425 kms
- Winnipeg to Old Crow,YK (furthest) - 3,060 kms
The resupply distances are considerable in most instances, and even if one was incorporating the most economical method of resupply, which is not the case, the costs will be higher managing a store network spread across the North.
Freight Handling – the Number of Touches
Retailers said in interviews that each time a product is handled or 'touched' before getting to the sales floor, the cost of getting the product to market increases. Retailers strive to limit the handling of a product through shipping in larger volumes and automating the handling processes as much as possible.
In the practice of northern grocery retailing, the same rule applies; however, the logistics of supplying remote communities requires a much greater degree of handling than in the South. The table at the top of the next page illustrates the handling requirements of perishable goods being transported to several northern markets. A southern store example is provided as context.
| Southern Store | Igloolik, NU | Lac Brochet, MB |
|---|---|---|
| Freight is loaded and departs supplier | Freight is loaded and departs supplier | Freight is loaded and departs supplier |
| Arrives at store and is unloaded | Arrives at retailers warehouse and is unloaded | Arrives at retailers warehouse and is unloaded |
| Product is moved to store shelf for sale | Product is loaded on a truck and driven to Winnipeg airport | Product is loaded on a truck and driven to Thompson airport |
| Freight is unloaded at the airport | Freight is unloaded at the airport | |
| Freight is loaded onto an aircraft bound for Iqaluit | Freight is loaded onto an aircraft bound for Lac Brochet | |
| Freight is unloaded at Iqaluit airport | Freight arrives at Lac Brochet airport and is unloaded | |
| Freight is loaded on to a different aircraft bound for Igloolik | Freight is loaded on to trucks and driven to store | |
| Freight arrives at Igloolik airport and is unloaded | Freight is unloaded at store | |
| Freight is loaded on trucks and driven to store | Freights is moved to store shelf for sale | |
| Freight is unloaded at store | no value | |
| Freight is moved to store shelf for sale | ||
| 3 total touches | 11 total touches | 9 total touches |
As the previous table illustrates, grocery products must be handled three or four times more between receipt from the supplier and stocking to the shelf in the North.
Transportation Summary
The preceding pages describe in some detail the additional effort and costs associated with supplying grocery products to stores in isolated northern communities. The table illustrates in dollars what this can amount to in transportation costs. To provide context, an all weather road served store (La Ronge, SK) is provided. These numbers have been provided by the North West Company.
| Community | Size of Store | Transportation (freight) Costs 2012 |
|---|---|---|
| Baker Lake, NU | 13,290 sq. ft. | $2.07 million |
| Iqaluit (NorthMart), NU | 40,988 sq. ft. | $5.41 million |
| Gjoa Haven, NU | 5,775 sq. ft. | $1.62 million |
| Fort Severn, ON | 7,800 sq. ft | $.40 million |
| La Ronge, SK (NorthMart) – All weather rd. accessible | 16,806 sq. ft. | $.33 million |
The inclusion of the transportation costs for the La Ronge, SK store provides an illustration of how a moderately sized store with all weather road freight access can be supplied for a year at significantly less expense compared to stores in isolated communities.
Bricks & Mortar
A second cost driver contributing to a higher cost of groceries in the North relates to the physical store presence in these communities. Maintaining a physical retail presence in remote northern communities is significantly more expensive than maintaining a retail presence in a southern community.
Initial construction costs of stores in remote communities are much higher and require significant logistical planning. The materials are trucked (winter) or barged (summer) into the community well in advance of the actual construction work. Much of the labour must be flown in and housed during the construction process.
In dollar terms, the North West Company indicated that the building investment in one of its southern Giant Tiger stores is about $68 a sq. ft. The building investment in its Northern Stores ranged depending on location, age and size of the store, but there were numerous examples of where this investment was well over a $100 a sq. ft. In Arviat, NU the investment in the Northern store was the equivalent to $119 a sq. ft. while in Lac Brochet, MB it was $279 a sq. ft. In Igloolik, NU the investment amounted to $155 a sq. ft. and in Aklavik, NT it is about $140 a sq. ft.
Based on interviews with retailers operating in northern communities, the general operation of a grocery retail store is more expensive in comparison to the running of a store in the South. Retailers identified three areas in particular as more expensive in the North than the South: warehouse to retail space ratios, electricity costs and repair and maintenance costs. A summary of each of these costs is provided below.
Warehouse to Retail Space Ratio
Warehousing requirements and subsequent costs are much greater in isolated northern communities. Unlike southern retail operations with the standard practice of "just in time" delivery of groceryproducts, isolated northern stores must maintain a much greater amount of stock in the community. This requirement is typically met at one time in the year when a more economical transportation mode is available. The warehouse space must be properly maintained for product storage. A significant amount of the warehouse space (typically over 60%) must be heated to prevent product from freezing. These undertakings increase the operational costs of running the store.
In a southern grocery retail situation, minimal warehousing space is required because product tends to go directly to the shelf. In discussions with retailers, NRG Researchers were informed that for every 1 sq. ft. of warehouse/loading space there is approximately 6 sq. ft. of retail floor space in the South. In the North, this ratio varies significantly, as per the following examples:
- The Northern Store in Igloolik, NU – 1 sq. ft. warehouse to 2 sq. ft. of retail.
- The FCNQ Co-op in Puvirnituq, QC - 1 sq. ft warehouse to 3 sq. ft of retail.
- The Northern Store in Rigolet, NL– 1 sq. ft. warehouse to 1 sq. ft. of retail.
Electricity Rates
Electricity costs are significantly higher in northern communities because electricity is produced by diesel generators. The following table summarizes the electricity rates experienced by stores in various northern communities. Not only are diesel generators less efficient than large power stations, but the electricity charge also bears the cost of transporting the diesel fuel to the communityFootnote 4.
| Store Location | Per Kwh rate (2014) | Per Kwh rate MB (2014) | Per Kwh rate ON (2014) |
|---|---|---|---|
| Arviat, NU | $.65 kwh | $.06 kwh | $.09 kwh |
| Igloolik, NU | $.86 kwh | $.06 kwh | $.09 kwh |
| Aklavik, NT | $.42 kwh | $.06 kwh | $.09 kwh |
| Rankin Inlet, NU | $.51 kwh | $.06 kwh | $.09 kwh |
| Iqaluit, NU | $.46 kwh | $.06 kwh | $.09 kwh |
| Gjoa Haven, NU | $.76 kwh | $.06 kwh | $.09 kwh |
| Lac Brochet, MB | $.34 kwh | $.06 kwh | $.09 kwh |
In addition to higher per kilowatt rates that many northern stores are subject to, a monthly electricity demand rider is often assessed over and above the variable cost for the electricity consumed. Depending on the size of the store and warehousing being heated, the demand rate can be hundreds to several thousand of dollars a month.
To put this into perspective, the 19,220 sq. ft. Northern Store in Rankin Inlet, NU spent $384,334 on electricity costs in 2012. The similarly sized NorthMart store in La Ronge, SK (16,800 sq. ft.) is on the electricity grid and subject to a $0.09 kwh rate. This meant NorthMart spent $58,500 in 2012— almost six times less than the cost of heating and lighting the Rankin Inlet, NU store. Temperature differences resulting in varying heating needs is also a factor to be considered. The average high temperature in Rankin Inlet is -7°C, while it is +6°C in La Ronge, SK.
Repair and Maintenance Costs
Repair and mechanical maintenance are other factors that impacts the costs of northern grocery retailers compared to the southern retailers. During conversations with retailers, this was reported as a growing challenge because in response to consumer demand there has been a gradual increase in frozen and chilled products being carried in the stores. Retailers indicated that refrigeration now accounts for approximately 15% of the selling space in a typical store in the North. The increased refrigeration/freezer requirements increase the need for maintenance activity or repair incidents.
According to retailers, local mechanical repair capability is almost never available in the NNC-eligible communities. If a store does require service, a technician must be flown in and is typically required to stay at least a full day (10 hours) in community.
Following are examples of average refrigeration repair/maintenance incident costs to the northern retailers:
- Rigolet, NL - $3,900 per incident
- Lac Brochet, MB - $3,500 per incident
- Iqaluit, NU - $6,100 per incident
- Aklavik, NT - $3,500 per incident
- Baker Lake, NU - $5,800 per incident
The cost of a similar refrigeration repair/maintenance incident for a southern retailer is much lower, averaging in the hundreds of dollars, unless there is significant travel time involved.
Retailers were unable to provide a global sense of how much of their operating budget was devoted to repairs of this nature. A representative from the Nunavik cooperatives, FCNQ, indicated that their stores are encouraged to budget 3% to 4% of their overall operating budget for repairs.
Wages and Salaries
Another cost driver mentioned by retailers relates to staffing costs. Head office staff and store managers indicated that they typically have to provide a higher level of pay than for equivalent staff in the South, most notably in Nunavik and Nunavut regions. In northern Manitoba and Ontario, the differential in staffing costs is less. An FCNQ representative indicated that staff wages tend to be 15% to 20% higher for their Nunavik stores than for comparable positions in Montreal.
The wage differential between the North and South may in part be driven by the high costs of living and housing costs in the North. Looking at employment opportunities within the Government of Nunavut, there is a great range in possible remuneration. Recent job postings drawn from the Nunavut Government website (summarized in the following table) illustrate a range of remuneration, from over $55,000 to about $122,000, based upon job description. These examples are intended to be illustrative and not representative of the distribution of available positions.
| Job Description | Location | Salary | Northern Allowance | Northern Allowance as Pct of Salary | Total Income (incl Northern allowance) | FTE Total Income (incl N. allowance) based on 200 x 7.5 hr days/yr |
|---|---|---|---|---|---|---|
| Source: Government of Nunavut | ||||||
| Janitor - Education | Arctic Bay, NU | $24.56 | $12.24 | 49.8% | $36.80 | $55,200 |
| School Secretary - Education | Kimmirut, QC | $30.84 | $9.81 | 31.8% | $40.65 | $60,975 |
| Petroleum Products Clerk - Community and Government Services | Pond Inlet, NU | $56,394 | $24,214 | 42.9% | $80,608 | no value |
| Call Centre Agent - Community and Government Services | Iqaluit, NU | $74,217 | $15,016 | 20.2% | $89,233 | no value |
| Manager, Policy and Legislation - Community and Government Services | Iqaluit, NU | no value | no value | no value | $101,498 | no value |
| Homeownership Analyst - Nunavut Housing Corporation | Arviat, NU | $86,873 to $98,592 | $21,113 | 21.4% - 24.3% | $107,986 to $119,705 | no value |
| Director, Population Health - Health | Cambridge Bay, NU | $102,556 | $19,716 | 19.2% | $122,272 | no value |
Public sector employment in the North is frequently accompanied by some "northern allowance" designed to maintain real incomes, at least at the level experienced in the South. Northern allowances are common within government positions, and appear to be "progressive", in that the allowance is higher, on a percentage basis, for job classifications associated with lower incomes.
The presence of large northern allowances (increasing effective salaries by up to 50%) illustrates that costs of living are acknowledged to be significantly higher in the North. In addition to northern allowances, subsidized housing is also made available for some job descriptions, although the housing stock appears to be tight.
With northern allowances being very common, the effects of these measures may, in fact, be incorporated into the expectations of those in the North, creating inflationary pressures on prices of goods and services. While the examples in the previous table apply to Nunavut Government employment opportunities, other employers operating in the North have to compete with these levels of remuneration.
On a number of occasions, companies operating in the North said they were out-bid for staff by the Nunavut Government. A Co-op manager in one community recounted a specific instance where he hired a local employee with skills well suited to their retail operation. However, the employee was enticed away from the Co-op by a much higher remuneration package offered by the Nunavut Government. Not wanting to lose a valued employee, the Co-op manager met the government bid. However, the Nunavut Government recruiter then raised the government's offer beyond the Co-op's ability to match. This is apparently not a rare occurrence when potential employees with a desirable skill set and work ethic present themselves. This is also not a new phenomenon, as during a 2010 presentation to a University of Manitoba conference, a northern airline management staffer reported that "We compete with (the) government for employees."
Not all citizens in the North are sought out in this fashion, and not all are offered what appear to be generous remuneration packages. As a result, there is a great potential for bi-modal income distributions, in which a large number of well-paid employees can function quite well in the expensive northern environment, but another large group are struggling. As cited in the recent Canadian Council of Canadian Academies report on aboriginal food security, "the average weekly cost for groceries across the region … was … $19,760 per year … in comparison, 49.6% of Inuit adults earned less than $20,000."Footnote 5
The bi-modal income phenomenon is not distributed evenly across the communities in the North. Larger communities with a larger percentage of "southern imports" (such as Iqaluit with 42% non-indigenous residents) have a greater potential for that income dispersion. As an air carrier employee indicated, "Government dominates the activity in this town (Iqaluit)." It is likely this dominance was not as significant prior to the creation of Nunavut as a separate territory in 1999.
Another staffing concern heard from store managers was the need to maintain a larger staff complement than normally required for a store located in the South, resulting in greater time spent on human resource (HR) issues. While not a direct cost driver, staffing and HR issues do tend to occupy a greater amount of store managers' time when operating in the North.
Spoilage and Shrinkage Losses
Product loss from spoilage or shrinkage represents another factor in which stores operating in remote northern locations are subject to situations unique to where they operate compared to grocery stores in the South. Retailers indicated product losses are higher in the North. It is worth noting that the costs of shrinkage in the North are higher than just those of the absolute volume, because with every item lost there is the additional cost associated with it being transported and stored at a higher cost than in the South.
Spoilage
Spoilage is defined as product deterioration that is expected even under the best operating conditions. It is an assumed part of operations and factored into the cost of doing business. According to a representative from North West Company, typical southern rates of spoilage make up approximately 0.4% of total sales.
Risks of spoilage are greater when retailing in isolated northern communities. The risks are greater due to:
- Time and distance to market – the travel is prolonged and at times can be rough leading to bruising. In addition, the many handlings of the product can lead to damage;
- Delays in transport due to weather conditions can lead to spoilage;
- Exposure to weather extremes – Many store managers and some consumers reported seeing fruits and vegetables touched by frost due to the transfer from plane to store. Extreme heat occasionally experienced in northern communities was also noted as a more recent problem;
- Smaller markets, with a tendency for greater variance in consumption of lower demand items, with a greater likelihood that the store will either run out of stock or have the product age on the shelf beyond its Best Before Date; and
- Best Before Date issues – unlike southern retailers, there is no recourse in terms of possibly returning this product to the manufacturer for a credit.
The last point in the preceding list warrants a more detailed discussion as it represents a particular challenge for northern retailers. Best Before Dates on dairy, fresh meats and processed foods have been utilized for grocery products for a long time and consumers are aware of the Best Before Dates when purchasing these products. Based on feedback from consumers, store managers and personal store visits, the presence of "expired" products on the shelves appears to be a declining issue in northern retail stores. Managers indicated that through careful ordering they typically do not lose much product to shelf life issues. An exception occurs occasionally when a new dairy product is introduced but does not sell well. It then must be disposed at a loss.
While the Best Before Date issue may be less of a concern than in the past, it should be noted that there are numerous misconceptions with terms such as 'Best Before' or 'expired.' The Canadian Food Inspection Agency may have clear guidelines about date labelling for terms such as 'Durable Life,' 'Best Before' dates, 'Expiration' dates or 'Use By' dates, but the consumer is woefully unaware of the distinctions. In virtually all consumer discussions involving these terms, they were perceived as interchangeable.
A stamped 'Best Before' date was perceived as the same as an 'Expiry' date. The 'Best Before' date was the most common labelling, although some items (such as infant formula) have 'Expiry' dates. In some instances, NRG researchers observed customers "stocking up" on discounted infant formula that was approaching its expiration date. When asked, the customers stated "if something is on sale, it is about to expire." Unless these customers were buying for a number of households (a possible scenario), it is possible much of the product purchased would have been used after its expiration date.
Product dating is a challenging issue for retailers in northern Canada. Store managers stated that it is difficult to manage the annual influx of inventory during the resupply period. Efforts are made to order product with as much shelf life as possible. However, problems arise when manufacturers send up in a resupply shipment product with a shorter Best Before Date than what they had requested in the order. Unlike store managers in the South who are able to send product back to the manufacturer if necessary, stores in the North do not have the same recourse.
Retail managers and head office representatives stated that it was policy to ensure that no product was on the shelves past the Best Before Date; therefore, stock was sold at a significantly reduced price as it neared its Best Before Date. This represented a profit reduction or loss for the store on that product. In-store visits confirmed this activity as there were almost always significant sales (50%) on products that were nearing their Best Before Dates.
To manage the dating issues some of the larger northern retailers maintain a sophisticated ordering system that incorporates the products' Best before Date life span. The annual resupply for the stores takes Best Before Dates into account to prevent ordering too much stock that would then reach its Best Before Date and not be available to be sold. The down-side for cost control is that if there is an unexpected increase in consumption of a commodity, additional stock may have to be brought in through more expensive air freight.
Shrinkage
In the retail industry, shrinkage is defined as a reduction in inventory due to shoplifting, employee theft, paperwork errors and supplier fraud. In North America, the industry standard rate for shrinkage is 1.5% of total sales.
No retailers were prepared to provide a definite number as to what percent of product was lost to shrinkage factors. Over the course of the ten community visits, very different pictures emerged regarding the seriousness of shrinkage issues. In some communities, retail managers said shrinkage was not a particular problem (although there were anecdotal exceptions). These communities tended to be located in the far north (Northwest Territories, Nunavut and Nunavik).
In some locations, store managers said that product shrinkage from theft was a fairly significant problem. A unique challenge for retailers in combating this problem was the fact that store staff who try to mitigate shop lifting have a difficult time doing so. Because some communities are quite small, staff members are uncomfortable confronting other community members (some of whom may be relatives). The managers in these instances said they usually are called upon to deal with these occurrences.
Product Loss Summary
The rates of spoilage reported by retailers in the North varies somewhat. The North West Company reported a spoilage rate of 1.5%, three times higher than the industry norm. However, this number excludes lost revenues due to Best Before Date issues and shrinkage. The North West Company would not share what a global product loss percentage was, but a few retail store managers provided estimates that ranged from 5% to 20% of total sales. Some store managers of non-North West Company operations also provided estimates of spoilage rates and their estimates were not inconsistent with the ranges provided by North West Company staff.
In the Nunavik community of Quaqtaq, QC, the spoilage rates estimated at the Federation des Co-operatives du Nouveau Quebec were in the 15% to 20% range. The reason for the higher rates was that it was near the end of the air freight run which meant produce was handled more frequently and exposed to the elements more often.
Carrying Costs Associated with Annual Inventory Resupply
During interviews with retailer head office personnel, the issue of carrying costs associated with the annual major resupply of a northern retail operation was raised as another unique cost that impacted the eventual costs of groceries in the North.
As already noted in this report, it is normal for northern grocery retail operations to conduct a major inventory resupply when a more economical freight option is available—winter roads or barges. This process undoubtedly saves considerable costs relative to resupply via the more expensive air freight option. However, this adds another cost to retailers because they must purchase almost a year's worth of inventory at one time, and then warehouse it over the course of the year while the product sells. This represents a significant upfront financial outlay for which there are some carrying costs associated. The retailer has effectively purchased product that will not entirely sell for almost a year.
It should be noted that retailers operating in the South do not have to undertake anything resembling the resupply process of northern retailers. Most southern retailers operate by ordering enough product to last the store approximately one month. The retailer generally has 30 days to pay for this product. However, this product will be almost entirely sold by the time payment is required and the process repeats. Southern retailers seldom have to provide a major financial outlay for product that will not be sold for almost a year. The following table provides estimates of the costs to resupply stores (annually) located in the remote north compared to the inventory costs to supply a store served by an all weather road.
| Community | Size of Store | Inventory Costs 2012 |
|---|---|---|
| Baker Lake, NU | 13,290 sq. ft. | $1.7 million |
| Gjoa Haven, NU | 5,775 sq. ft. | $1.6 million |
| Iqaluit, NU (NorthMart) | 40,988 sq. ft | $6.0 million |
| La Ronge, SK (NorthMart) – All weather rd. accessible | 16,806 sq. ft. | $0.5 million |
When standardized on the basis of store square ft., inventory resupply costs for stores such as those in Iqaluit or Baker Lake are in the range of 4.3 to 4.9 times higher than the same value for the La Ronge, SK store.
For comparative purposes, the La Ronge, SK store, serviced by an all weather road (non-NNC eligible), has inventory costs in the range of $30,000 per 1,000 sq. ft. of store area. Per 1,000 sq. ft. of store area, Iqaluit's and Baker Lake's, NUcosts are about $146,000 and $128,000, respectively. The Gjoa Haven, NUstore's costs are in the range of $277,000 per 1,000 sq. ft., or about 9.3 times that of the La Ronge, SK store. However, the Gjoa Haven, NUstore is quite small, so calculations on the basis of store square ft. could be subject to other factors. The fact remains that inventory costs per square foot are substantially higher in the North.
Grocery Retailer Profit Margins
A final contributor to the cost of groceries in northern Canada discussed in this study is the profitability of the companies involved in this service. This is a contentious aspect of northern retailing, which many local residents view as a significant reason why groceries are expensive (particularly in sole-retailer communities).
Profit is a normal objective of business. Within the theory of profit and margins several factors are possibly relevant to the discussion of the profitability of companies that retail groceries in the North. Some factors could impede profitability, while others could be seen as enhancing a company's overall profitability.
Retailing groceries into the North is a costly undertaking and its market environment is small, and therefore not easily suited to increasing savings through operational efficiencies. These factors would work against a company's profitability.
However, companies are selling a product that is in demand and the competitive forces in the North are different from the normal southern situation. In addition, based on the logistics and the locations of the stores, one can assume greater risk is involved than the comparable undertaking in a southern market location. In business, the Risk-Reward trade-off is a well-established axiom. An activity with higher inherent risks normally requires higher potential returns to justify investing in the endeavour. The complex supply chain and greater variance in meeting the needs of the northern food retailing supply chain likely equate to significant risk elements. As such, higher risk could understandably be met with higher potential or expected profit for companies retailing groceries in the North.
Retailers were unwilling to provide specific financial information regarding the profitability of their northern retailing operations for competitive reasons. Retailers did share some insights regarding the operating profit with respect to perishable items. In this grocery category, considering higher shrink/spoilage rates and high freight and operating costs, the combined operating profit is reported to be often less than the industry norm. Other grocery categories are somewhat more profitable and compensate for lower profits in other areas.
In the final analysis, it is likely that northern grocery retailers are making a profit from their activities in northern communities and therefore profit is a factor contributing to the overall cost of groceries. However, from the data sourced in this study, it does not appear that these profits are a significant contributor to the overall costs of retailing in remote northern communities, at least not in relation to the other cost drivers discussed in this section of the report.
Community Level Findings
Summary of Community Level Findings
Ten communities (listed on page 10) were included in this study. They were selected because each possessed different characteristics as a community that collectively provided a representation of the 103 plus NNC-eligible communities in northern Canada. The communities addressed in this study:
- Are primarily First Nation or Inuit
- Range in size from approximately 300 residents to up to 7,000 residents
- May have only one grocery store option, while others have more than four
- May have winter road access, while others may have only ship or regular ferry service
- Vary in air service, as some receive air service several times a day, while others only a few times a week
Despite these differences, all communities noted their concern about the high cost and affordability of groceries. Employment is scarce in most northern communities and therefore most households rely to a great extent on single incomes and/or income assistance. The high cost of groceries and low employment results in challenges in meeting the household's food security needs.
In addition to concerns about the high cost of groceries, there is a consistent sentiment across the North regarding the following grocery related concerns:
- Selection is limited
- There are quality concerns in terms of produce (although apparently less so than in the past)
- There are strong sensitivities to Best Before Dates – often perceived incorrectly as expiry dates
Retailers acknowledge that their customers have these concerns, particularly about the cost of groceries. Their response is to point out the efforts being taken to streamline the operation and logistical processes that are in place to run the store. Their focus is to look for ways to reduce transportation costs. They have reportedly invested in inventory and supply management systems to improve the overall shelf life of products entering the stores.
Seasonal transportation is one feature of northern communities that leads to particular differences when it comes to accessing groceries and merchandise outside the community. When winter roads or summer ferries are available, a considerable amount of outshopping occurs with residents using alternative transport modes to travel to supply centres. Regionally, this includes the northern regions of the Saskatchewan, Manitoba and Ontario along with Labrador (ferry). It should be noted that this shopping takes place entirely outside the NNC program which only provides a subsidy for eligible products transported by air.
Another means for northern residents to avoid the high prices of groceries in the North is through direct "personal" orders to southern suppliers. Factors such as region, income and employment have an influence on the number of orders. Personal orders occur in the northern regions of Nunavut and Nunavik; however, some of these are being placed by southern transplants who are currently working in the community. Personal orders also occur in the North via the sealift/ship service that annually resupplies Nunavut and Nunavik communities. Suppliers offer northern residents the ability to purchase crates for shipment into the community along with the summer resupply.
Country foods are an important part of the diet of residents in the communities included in this analysis. There are signs however of a waning desire among younger local residents to actively harvest wild game. In addition, some communities are experiencing a shortage of game in their area to hunt.
Northern retailers are aware shopping occurs outside the community and recognize that they are losing revenue. Based on the information gathered in this study, however, there does not appear to be a strong sense from either the retailer or local consumer that this by-passing of the local store is having or will have a detrimental effect on the long-term sustainability of the store itself.
Awareness of the NNC program and its impact on grocery prices is low among the local residents of the communities we visited. This was the case even in communities with stores that, by observation, were relatively active in terms of putting up posters and shelf displays advertising the presence of the Program and its impact on prices. The larger retail chains tend to do a more consistent job at communicating the presence of the NNC program compared to independents.
Community Retail Case Studies
Consumer Profile & Shopping Behaviours
According to Statistics Canada and Territorial government data, communities in northern Canada are experiencing population growth that exceeds the rate found in the remainder of the country. This, coupled with a reported housing shortage most communities, results in some fairly large households present in these locations. In the focus groups, it was common to encounter representatives of households with 5 to 8 inhabitants. The households are also multi-generational and extended.
Unemployment in communities with predominantly indigenous populations tends to be high. Across nine of the ten communities visited, the unemployment rate ranged from 13% to 32%Footnote 6 of the adult population seeking employment. Iqaluit, NU, with a strong Nunavut Government presence and an approximately 40% non-indigenous population base, recorded an 8% unemployment rate. In Arviat, NU, with indigenous citizens comprising over 90% of the population, one local community administrator suggested that 70% or more of the population is on some form of income supplement. Local government officials in Rigolet, NLand Lac Brochet, MB, for example, identified a systematic effort by the local administration to 'share' available jobs in order to provide residents enough hours to qualify for Employment Insurance—"The 420 rule. You need 420 hours of work over three months."
The lack of employment is undoubtedly an influence on purchasing patterns, level and timing. For example, work schedules are not big factors in determining when people shop. In discussions with consumers and retail managers, it appeared the most significant determinants as to when people conducted a major shopping trip were the arrival of pay day or the delivery of income assistance cheques. Apart from the initial day or two after a pay day, or the arrival of income supplements, typical resident shopping behaviour consists of making several trips a week to the store, purchasing just enough to get by for a few days.
The size and age of the household has an impact on shopping patterns. For example, purchasers for larger families with teenagers are more likely to shop more often and for more items.
Garden Hill, MB, is somewhat of an anomaly in this regard. The three primary grocery stores available to residents are located on Stevenson Island which in the summer can only be accessed by boat. Not everybody owns a boat, which forces residents to take a water taxi to and from the store for $6 a round trip. The additional cost of the trip combined with the fixed income situation of many residents means fewer and larger shopping trips are more normal. Residents in Garden Hill can access an in-community store (The Convenience Store) but it is a smaller store with a limited selection of items and perceived by some residents more expensive than others stores for buying groceries.
There is little in the way of an "average" shopping frequency, although "twice weekly" is often mentioned. For a large number of respondents, shopping is a task that is undertaken as the need arises, with little planning. As such, there is little long-term meal planning, and shoppers often go to the store on the day of the meal to get last-minute ingredients.
Average household grocery expenditure varies dramatically, in part because of the wide range in household size. Some respondents report household grocery shopping costs of $100 to $150 per week. These individuals are typically from smaller households consisting of one or two people. Other individuals place their estimate of weekly grocery shopping costs at $300 to $400 for their household, while weekly grocery shopping bills as high as $575 are also reported. However, any estimates gathered in the group interviews should be considered carefully. As indicated, much of the shopping is done on an opportunity basis, and relatively few shoppers appear to develop a rigorous household food budget. When there is some semblance of a household grocery budget, it is for a particular shopping trip, but does not necessarily take into account the in-between trips throughout the week.
Complicating the determination of an average grocery expenditure, some residents indicate they outshop monthly for their meat, which reduces their weekly spending in the store, but the average expenditure amount definitely increases when the outshop amount for meat is factored in on a weekly basis.
In most communities, meat protein is a significant part of a majority of meals, either from country foods or store-purchased sources. Root vegetables are used commonly but, as with the South, pop and chips are almost always staples. The evening dinner is usually the main meal of the household and quite often the leftovers are consumed the following day.
Most retailers report a shift in their mix of food sales. Specifically, fresh dairy and produce, according to retailers are on the rise, although this appears to contradict some of the findings of the shopper focus group component, where a fairly stagnant food purchase mix is reported. One possible answer is that much of the reported increase in healthy (and NNC-subsidized) food is being purchased by some of the community professionals/leaders. In addition, the changes in community consumption patterns may be occurring incrementally over time and not in a manner that necessarily is an obvious change to the typical consumer.
Purchase Patterns - Meat
Overall, respondents suggest their main items purchased from the stores are meats and vegetables. Meat is a key grocery item in the communities visited where country foods are not in wide supply (such as Iqaluit, NU, Arviat, NU and Lac Brochet, MB). It is common to have 40% to 60% of the basket going to meats (usually frozen) with the remainder going to vegetables, canned goods and dry goods.
Not all stores provide fresh meat. In most communities, the Northern Store is usually the one offering fresh meat, and even they do not offer it in every community (retailers in most communities in Nunavut and Nunavik stocked only frozen meat). When fresh meat is available it is in limited quantities. According to store managers, fresh meat is more costly to supply and therefore an expensive item on the shelf (i.e., two piece rack of pork spare ribs - $30 in Lac Brochet, MB ). It did not sell well.
From a resident's perspective, while fresh meat is a desirable commodity, many suggest that considering the challenges of logistics in the North, the effort to provide fresh meat (rather than frozen) is just not worth the risk of spoilage. In communities without access to fresh meat (in Nunavik, for example) there is a desire for more fresh product compared to frozen.
Numerous complaints were made by local residents and in particular transplanted southern community professionals, regarding the quality of both fresh and frozen meat available—"too fatty, freezer burned and just not a good colour." For fresh meat in particular, the perceived quality issues combined with the cost of the product make it unattractive to purchase.
In certain stores, "frozen meat packs" (or just "meat packs") are a very popular choice. These stores tend to be in locations where accessing groceries outside the community is expensive and difficult, such as locations in Nunavut. In the winter road serviced communities of Aklavik, NT, Lac Brochet, MB, Garden Hill, MB and Fort Severn, ON, the meat packs offered in the local retailer are far less popular, as residents have seasonal access to cheaper meat pack options sourced in the South. Meat packs are offered in 9 of the 10 communities visited, with Quaqtaq, QC being the exception.
In Igloolik, these bulk packages tend to range from $90 to $190 and contain a wide variety of frozen meat cuts. For example, a $96 "Meat Pack #1" included 5 lbs. regular ground beef, 4 lbs. beef boneless blade steak, 2.5 lbs. pork shoulder blade steak, 10 lbs. pork neck bones, 11 lbs. chicken drumsticks and a 450 gram pack of wieners – about 33 to 34 lbs in total. Meat packs come in a variety of selections, and generally range from 33 lbs. up to 58 lbs. The per pound costs vary based on meat cuts in the package, but generally work out to $2.90 to $3.80 per poundFootnote 7. The meat packs appear to be an answer tailored to serving large households in remote communities.
The price of meat packs compare reasonably well to similar prepackaged frozen meat selections offered in southern grocery stores. A review of the products offered at Millers Super Valu Meats in Winnipeg, MB revealed similar priced frozen packages for the same total pounds ($99 for 31 lbs). However, the cuts of meat differ somewhat.
Purchase Patterns – Fresh Produce
Vegetables comprise the next largest food component in the stores, with dairy also representing a significant share of the basket. Root or hard vegetables fare better in the retail stores, although there have been attempts to diversify into the more tender (green) vegetables. There is a tendency among residents to purchase greater quantities of the root vegetables because they can be kept for longer periods in the home.
In Igloolik, a half cantaloupe filled with green grapes was selling for about $7. Green seedless grapes were $11.69 per kg. Lemons were $1.15 each. Apples were $7.65 per kg. The Co-op in Arviat, was selling bananas for $3.39 per kg. In Igloolik, a honeydew melon was priced at $6.49 and asparagus was $10.99 a bunch.
Where country foods are relatively abundant in a community, respondents indicated their purchase pattern at the local store(s) revolved around vegetables, side dishes and "scratch" ingredients.
A challenge with fresh produce purchases expressed in virtually all communities is that some items stocked by the stores are not familiar to residents. Residents said this led them to be cautious about buying the product, particularly when it is a relatively expensive food item, as is usually the case with fresh produce. Store managers acknowledged this as an issue and said they sometimes try to conduct in-store demonstrations and provide taste test to shoppers to introduce them to new produce items.
Residents mentioned that the packaging of the produce has an impact on their shopping behaviour. In some retail outlets the fruit and vegetables, particularly fruit, are displayed in a loose format (usually in a basket) allowing shoppers to select the quantity they desire. In other stores the produce is pre-packaged in bags. From the resident's perspective freedom to choose their own quantity is preferred because it allows them to manage their cost. In addition, there are some complaints that some items may be over-ripe, in a bag of fruit for example.
When retail managers are questioned why they bulk sell items, the response is it is easier to manage their inventory in this manner. No regional pattern is evident in terms of which stores sold produce in a loose versus packaged format.
In Lac Brochet, MB the Northern Store sells fruit and vegetables in single serving size plastic containers which are quite popular with residents, due to their affordability and convenience.
Some of these single serving size NNC-eligible products are flown in pre-packaged in this manner from the South while others are prepared in the store itself. The Northern Store in Lac Brochet, MB has a proper (from a health perspective) kitchen area where some on-site food preparation could occur. In subsequent community visits (Garden Hill, MB and Fort Severn, ON ) when these managers were asked why they did not offer pre-packed single servings of produce items, preparation space and display/cooler limitations were cited as issues.
Purchase Patterns - Dairy
Dairy products were a regular purchase for residents but did not make up a large share of the overall weekly purchase amount. This was another product type that generated concerns about being expensive. Cheese in particular elicited this reaction from residents as well as transplanted southern community professionals.
A 4-litre jug of 2% milk was priced at $7.99 in Arviat and $9.99 in Lac Brochet. In Arviat, a dozen large eggs was $3.49Footnote 8.
Purchase Patterns – Frozen and Processed Food
Local residents, store managers and some community support workers acknowledged that the purchase of this grocery product type was increasing. Residents indicated that the convenience of frozen prepared dinners was attractive. In addition, residents in the groups said their children have developed tastes for these products and are useful as a quick meal to prepare that all family members were generally guaranteed to eat.
In addition, residents from households that consumed country foods on a regular basis said they often provided frozen food dinners, as their children were tiring of the traditional foods. With probing, it was evident that the individual only prepared the country food item (in this case caribou) in a limited number of ways.
In the Arviat, NUand Lac Brochet, MB, a Swanson's "Hungry Man" Salisbury Steak Dinner was selling for $6.99, not far from its regular price in the South. In Igloolik, at the Northern Store, a similar frozen dinner product was priced at just under $11. In Arviat, NU, at the Eskimo Point Store, a precooked 575 gram "44th Street Beef Pot Roast" was priced at $11.99. At the same location, a 284 gram package of breaded and stuffed chicken breasts was priced at $4.99. A package of eight "Eggo" frozen pancakes was priced at $8.59 at the Northern Store and $8.49 at the Co-op. This was several dollars more expensive than in Rigolet.
Purchase Patterns – Other Items
Bread was another frequently mentioned purchase item and a grocery product subject to some consistent complaints from residents. Freshness seemed to be a concern, as well as selection or variety. From the in-store observations, there was not a great deal of stock of different bakery items in many of the stores.
In northern Manitoba, Ontario and Labrador communities, there was a desire expressed by local residents to have a fresh bakery in the community. Individuals in these communities said they did a lot of their own baking (bread and bannock) and would be interested in having access to other fresh baked products.
Packaged or dry goods were purchased regularly, but these were also items that would be included if shopping trips outside the community occurred. From the in-store observations, the price for canned and packaged products could vary quite dramatically by product and even brand of product. In follow-up questions with managers, the reason for these variations in price between similar products was often due to a canned or packaged item having to be flown in to replace stock originally supplied in a more economical manner (winter road/barge/sealift/ferry). Examples of this were Coca Cola in Rigolet, NL $22 (flown-in) vs. Pepsi $15 (ferry). These price fluctuations aggravated local shoppers who did not always fully understand why the price fluctuated to such a degree on products in response to mode of delivery.
While not mentioned directly, through probing and from in-store observations (and discussions with store managers), confectionary items (soft drinks, chips, candy, etc.) are very common items purchased.
In communities with multiple shopping options, customers often assign their purchases by store. For example, the Northern Store often tended to be the destination for "fruits and veggies", whereas the Co-op may be used more for general merchandise (particularly among Co-op members). In Garden Hill, MB, the Northern Store was preferred for produce and for larger general shopping trips, as it was said to have the best selection and reliable in-stock of all stores. The Mikiskew store, however, seemed to have a better reputation (more affordable) for frozen meats.
From a pure reputational standpoint, in communities with multiple stores present, a Co-operative structured store tended to be perceived more positively by local residents. This however did not necessarily translate to the Co-op being the store where residents most frequently shopped.
In communities such as Arviat, NU or Garden Hill, MB, which had independent stores operating, these outlets tended to place a greater emphasis on approaches to develop a strong following among younger shoppers. This was done by having a good selection of confectionary items available for consumers, including soft drinks and snacks.
Consumer Impressions of Grocery Retail in the Community
As in previous studiesFootnote 9, much of the discourse around the consumer impressions of the strengths and weaknesses of food retailing in the North has been driven by anecdotes associated with:
- Exceptionally high prices;
- Too much "junk food" and not enough nutritious foods;
- Expired /spoiled product and Best Before Date concerns;
- Lack of stock; and
- The lack of retail competition.
High Prices
The high price of food is the consistent prevailing sentiment across every community. When NRG researchers asked participants to describe some of the things that food retailing in their community was doing well, most comments were prefaced or accompanied by the assessment that prices were too high. There were no unprompted acknowledgments that prices have stabilized or reduced. For example, the availability of fresh produce at the Northern Store in several communities was occasionally complimented, but this was almost always prefaced with a proviso that "Food is always fresh at the Northern Store but the price is too high."
Fresh meat is available at some Northern Store outlets which, while perceived as a positive feature by some consumers, also came with a caveat, "it's good for people who have regular incomes and can buy at cheap prices at the end of the week and freeze them."
In the context of the price criticisms, some of the pricing anecdotes almost took on the tone of folklore. For example, a respondent asked if anyone "went to see the $100 turkey?" While the turkey may have cost $100.00, this appears to be a data outlier. Similarly, the $28 cabbage cited in other research may also be an outlier.
In several instances the NRG Researchers heard from residents (Aklavik, NT, Lac Brochet, MB and Garden Hill, MB ) about different products (pomegranates and milk) being available in one of the stores and how these were "outrageously" quite expensive. The pomegranates were said to be about $5 to $6 and the 4-litre of milk was around $13 to $14. However, when the NRG Researchers followed up at the stores it was determined the pomegranates in Aklavik were $2 and the 4-litre of milk in Lac Brochet and Garden Hill were $10 and $8, respectively. The items were not as expensive as earlier reported.
Too much "junk food" and not enough nutritious food
Another concern frequently raised was the lack of or an inconsistency of stock at some retail outlets. This was exacerbated by an impression among some that if shipments are disrupted, the stores appeared to make sure the pop and chips were delivered first.
Expired /spoiled product and Best Before Date concerns
Sometimes stock is available, but it is not up to the standards of the shoppers. Spoilage, particularly in produce, was a frequent criticism leveled at the current retail experience. Almost all respondents were able to cite instances where product was rotten or damaged. In several communities comments from residents identified problems with the presence of what, in their opinion, were clearly spoiled –"rotten"—produce on the shelves. The perception of some residents was that store management did not appear to care to remove the spoiled produce.
When this concern was raised other residents noted that store management can play an important part in addressing some of these concerns. In Rigolet, NL and Quaqtaq, QC, interviewees noted that the current management has been very good at checking the produce section and removing spoiled items.
Another produce related concern associated with fresh produce was the damage that was perceived to occur getting the fruit or vegetables into the store after arriving in the community. It was noted in several communities that this is sometimes a challenge, particularly in winter where it can be damaged during transport through exposure to freezing temperatures.
The discussion related to spoilage quickly shifted into a discussion of expiry dates and Best Before Dates. Respondents basically make no distinction between expiry and Best Before dates. If the date has passed, the product is perceived as having "gone bad." It also does not seem to matter if the commodity is time-sensitive dairy or more durable dry goods (or soft drinks).
As with pricing, there was a lot of discussion regarding the presence of expired goods in their local grocery stores. All participants recounted times when they came across goods past their due date. On some occasions, the time was not just months but years past their due date. There is a significant amount of suspicion regarding the motives of the store when 'caught' with expired products on their shelves. There is the impression that the store is trying to pass the product off onto the shopper.
In all communities, there was a virtually universal awareness that when a store deeply discounted an item, usually by 50%, that meant it was coming close to its Best Before Date. Shoppers were quite perceptive in this regard and customers in a few locations suggested stores could do a better job managing their expiration date issues by putting more items on sale earlier.
The general data collection procedure was that on the first day of their visit to a community, the NRG Researchers visited the retail sites and conducted a walk-about of the store, including a sampling of price checks. On the second day of their visit, the NRG Researchers conducted the community shoppers groups. On occasion, participants in the shoppers groups mentioned that milk was often sold despite it being expired. In one particular instance, having visited the store earlier in the day, the NRG Researcher was able to report to respondents in the group that milk jugs had 7-10 days shelf life before expiry dates.
Upon hearing this information, residents were surprised, and welcomed the opportunity to visit the local store and purchase jugs of milk. As with some of the often-reported outlier prices, it is possible that some of the concerns about expiry dates have been embellished and re-circulated. A more thorough in-store sampling would be required to test this hypothesis.
In Rigolet, NL and Fort Severn, ON, residents mentioned some personal experiences with Best Before Date while outshopping. Several individuals said they had difficulty ensuring that various dry goods products (cereal, granola bars and crackers) had Best Before Dates of at least 6 months in order to last the winter. This personal situation did shed some light on the challenges that stores encounter as they attempt to stock up on various goods to last to the next resupply.
As a follow-up to concerns about the lack of stock, respondents were asked what the stores could be providing that is currently not available. Interestingly, one service or feature that was often raised was a desire for an in-store bakery. Few suggestions or observations in the groups generated a level of interest or excitement that rivaled this recommendation.
Additionally, there were comments from residents that the provision of dry goods and many staples was adequate and, in some cases such as in Rigolet, NL Lac Brochet, MB and Fort Severn, ON, selection has increased modestly from years past. In Lac Brochet, MB, a few individuals acknowledged that the quality fresh produce in the store seemed better over the past few years.
Based on the small sampling of transplanted southerners interviewed during this study, it was somewhat more common for these individuals to have a more positive view about stock than local residents themselves. This was particularly the case for fresh produce, where it was often mentioned by these individuals that they thought the quality of the produce was not bad at all considering the distance it to travel to get to the store's shelf. Price was still a concern for these Southerners, particularly for fresh produce, meats and cheese; however, there was less suspicion about the store's profit motive and more attribution of the high price to freight costs.
The Lack of Competition
Of the 10 communities included in the study, four were served by only one grocery store (Rigolet, NL, Lac Brochet, MB, Fort Severn, ON and Quaqtaq, QC). The rest of the communities had at least two local grocery stores.
As noted earlier, shoppers in every community, regardless of retailing options, complained of high prices and a lack of product variety and selection. In single store communities there appeared to be a heightened level of distrust of the retailer as to why the prices were so high. Representatives from the community shoppers groups in single-store communities expressed resentment toward the store, stating they felt they were being taken advantage of due to a lack of competition in the community. The general belief was that prices could be significantly lower if the company chose not to be so profitable. This view, often held by local residents, was sometimes shared by local government officials in single store communities. When there was only one store present in the community, other concerns were often viewed through a lens of suspicion in terms of the store's motives and reasons why certain things were the way they were in the store.
Conversely, respondents in multi-store communities said that the presence of shopping options "kept them [stores] honest," although this sentiment did not seem to reduce the number of complaints regarding the price of groceries in the community.
Most multi-store communities have a Northern Store and a locally run Co-operative. Garden Hill, MB is the sole exception in this regard where the competition to the Northern Store is provided by several independent sole proprietor retailers. Co-operatives (Stanton's or Arctic Co-op) were somewhat better perceived than the Northern Store because of their local ownership structure and paying dividends back to community members. However, based on feedback from shoppers, the Northern Store was the more frequently shopped-at location because of its selection of products and reliability to be in stock.
Perceptions of Changes / Trends in Grocery Retailing
In initial discussions, participants in the community shoppers groups did not readily volunteer any instances of change in retailing in the past 5 years, and where change was noted, it appeared to be marginal or incremental. However, as discussions progressed, respondents generally noted instances of small changes to store layouts as improvements. Also, respondents indicated that the amount of space dedicated to freezer space or produce appeared to have increased.
Also, some price changes were noted. In some cases, prices were observed to have increased, while prices for some other commodities, milk for example, appeared to have decreased. Consumers did not credit the NNC for any of the price declines.
When asked what factors could have affected prices, respondents tended to focus on perceived increased competition, such as pressure from "shopping from Wal-Mart", or community or media pressure. In Rigolet, NL, there were very few comments regarding any lowering in the price of goods, but there was an acknowledgement that the produce was of a better quality and in the store more regularly.
A change or trend discussed in almost all communities in the study was the presence of different fruits and vegetables. In Rigolet, NL, individuals recalled more dragon fruit and different squash being sold than in the past. In Aklavik, NT, Lac Brochet, MB and Fort Severn, ON, there was also reference to more exotic fruits being available.
Local residents indicated they valued the opportunity to experience different fruits and vegetables; however, they appreciated it when the store provided some information or even a demonstration on how the new produce could be used. In several communities, in-store tastings were provided when new fruits were first brought into the store. As one individual said, "the new products are usually a bit more expensive so it's nice to at least try it first before you spend all that money."
Consumer Awareness of Seasonality / Resupply
Respondents are generally well-versed in the seasonality and resupply aspects of their communities.
Weekly Resupply
In terms of the regular air supply, respondents typically were able to identify how often and on which days of the week flights arrived with the weekly grocery resupply. Awareness of this is higher in the smaller communities where the interviews were conducted (Aklavik, NT, Lac Brochet, MB, Fort Severn, ON, Rigolet, NL and Quaqtaq, QC), where some of the individuals could actually indicate the time of day the flights arrived.
There was also evidence of a good awareness regarding weather delays or cancellations, which, according to shoppers and managers, are fairly common. Through observation, there seemed to be a good flow of information regarding flights into the community at large, even though there was no apparent formal means of communicating this information.
Awareness of the air-freight schedule into the community does allow some local residents an opportunity to time their store visit in attempt to ensure they have access to the freshest produce available that week. Transplanted southern workers were particularly inclined to report making sure they were in the store shortly after a new order of freight arrived into the community.
Representatives in the community focus groups from smaller communities mentioned the need to get into the store quickly after the freight arrived more often than in larger centers. They noted that quantities of fresh produce were not large and could sell out quickly. It appears that the amount of supply brought in on a flight could vary among trips, resulting in some resupply trips providing less fresh produce for example than others.
Store managers acknowledged this happens sporadically. The reason provided was that because communities are quite small, they are often part of a freight run circuit supplying several communities. Occasionally, other communities on the route require additional freight which means freight destined for some communities on the circuit may be shorted. Managers did not characterize this as a problem, but rather an "occurrence". The shorted freight typically was made up on the next flight in.
There was no strong indication in larger communities that consumers adjusted their shopping patterns significantly based on the resupply schedule of the store(s) in the community.
Annual Resupply
The arrival of the annual resupply event was very well known in all communities included in this study. This was either the arrival of summer resupply ship/ferry to Nunavut, Nunavik and Labrador communities or the opening of the winter road for northern Manitoba, Ontario and some NTcommunities.
For those communities resupplied during the summer, there was much anticipation regarding the ship's arrival. The anticipation was not entirely regarding the prospect of a new supply of groceries, ordered by both retailers and individuals, but rather the ship also brought other merchandise, such as vehicles or furniture, ordered by residents.
The ships resupplying the community are quite large which adds to the local excitement. The process of unloading can take some time and involve a number of community members. In some Nunavut and Nunavik communities the event was described in somewhat festive, holiday-like terms.
The opening of the winter road into a community did not generate the same kind of one-day excitement, but the road's arrival was no less an anticipated event. News of the winter road being safe to travel spread quickly in the community and initiated plans by community members to travel out of the community on the long drive to a southern destination. In Aklavik, NT, the drive was a relatively short one to Inuvik, but with access to the road, transportation to and from the community improved demonstrably.
The arrival of the winter road season was welcomed not only for improving transportation access into the isolated community, but the roads also provided much needed employment for locals. Stretches of the winter road network are maintained by local communities and funded by the federal and provincial governments. Given the scarcity of employment opportunities in northern communities, this was a good time of the year for the community.
In all communities, residents did not mention that they noticed any change in the type of stock or pricing of goods in the local grocery stores when transportation access into the community improved. The most noticeable difference was a greater volume of stock appearing on the shelves, which up until that point, had been getting sparse for some products.
In a few locations, most notably in Nunavut, Nunavik and Labrador, consumers said there was a period of time when stock-out levels were high. This was usually a month or two before the resupply ship arrived. In addition, there were mentions that some products jumped noticeably in price because the warehoused product brought in for the season had run out.
According to store managers, this was because new product had to be brought in by air in advance of the traditional annual resupply event and, as a result, was sold at a higher price. This 'shoulder' season affected some higher selling packaged goods—cereals, sugar, coffee and pop. Product expiration dates also entered into this equation as well. If the prior annual resupply did not provide an adequate Best Before Date period this could lead to the product being sold off in advance of the next resupply event.
There was a good appreciation in all communities of the importance of the alternative resupply routes to the local stores when they became available. For the most part, local residents' personal activities mirrored the stores' resupply requirements. That is, as the stores took advantage of the less expensive transportation access to re-stock, so too did local residents in terms of increased outshopping.
Characteristics of Grocery Stores
Ten communities were visited over the course of this study. This involved site visits and interviews with managers of 22 northern retail operations.
When visiting several stores, NRG Researchers noted similarities with grocery stores in the South in terms of being well appointed, well lit and well organized. Aisle space and the frozen and chilled product display areas in some stores in the North were as modern as would be found in many southern retail operations. These stores, upon discussions with the manager, had under gone extensive renovations recently or, as in the case of Lac Brochet, MB, been recently re-built.
Other stores had not been renovated recently. These stores were crowded, the aisles were quite narrow, the lighting was dimmer and there was a somewhat 'tired' feeling about the property. All available space was utilized for either display or makeshift storage. The freezer and chilling units had a more haphazard look to them as if they have been added into the store pieces at a time.
Retail head office personnel acknowledged that some stores in their respective networks required renovations. The retail chains monitored the state of the stores and appeared to plan well in advance which stores would be subject to upgrades and the extent of those upgrades. In addition, some stores are located on leased land from the local government or Band, which may further complicate development.
In terms of the share of retail to general merchandise, it typically seemed about 70% to 75% of the store was devoted to grocery products. In almost all communities, the local post office was located in one of the stores along with an ATM machine. Some stores maintained a coffee shop/snack area in part of the store. In Iqaluit, the North West Company's retail presence was in the form of a NorthMart store which was a very large store (relative to typical northern retail operations) and contained numerous non-grocery related amenities. In several communities, most notably northern Manitoba and Ontario, the stores provided fuel services to residents.
Warehousing capacity at the various stores visited consisted of a 'hodgepodge' of facilities. Unlike southern retail operations, a great deal of warehouse capacity is almost always required for retail operations in remote communities. In the South the retail to warehouse ratio is usually 6 sq. ft. of retail to about 1 sq. ft. of warehouse, the North's ratio was 1:2 or 1:1 in terms of warehouse space compared to retail floor space.
The warehouse space was required to store the grocery store's provisions that generally came in at one time during the year and which had to last until that same time a year later. Stores generally had what can be described as two types of warehousing: short-term and long-term or main warehouse.
Short-term warehousing was located in the rear of the store and consisted of an unrefrigerated area where goods were brought in from the main warehouse or from an air resupply. The products were stored or staged temporarily until they could be placed on the shelf. Some newer stores had more space in this area, but for most stores it was small and made for very cramped quarters. In this rear area of the store was usually one cooler unit, about 8 ft. sq. and one freezer unit that was typically a little bigger than the cooler unit.
The cooler unit was a transitional facility as goods flown in typically filled this up and then emptied as products were placed on display in the store. The freezer unit served more as storage, but it too was replenished by fly-in resupply. In some of the independent stores visited, the freezer storage consisted of floor or chest freezers as opposed to actual walk-in freezer units.
The long-term or main warehouse capacity was sometimes external to the store in separate building. In a few cases the long-term warehousing was attached or in the basement.
The main warehouse area often consisted of a range of available storage structures that included:
- Semi-trailers
- Existing sheds and garage
- The old store building
- An old house
- Basements
- Shipping containers (usually referred to simply as "Cans")
The warehousing was organized by product type. About 40% to 50% of the main warehouse area was devoted to a range of food stuffs. This product was stored in a facility that could be heated throughout the year. The remaining warehouse space was usually split between household goods (that did not require heating), furniture and hardware, oil and vehicle supplies.
The warehousing that supports the northern retailing operations is configured to maximize the amount of stock held in the space available. However, this may not be the most efficient warehousing set-up from a stock access and retrieval standpoint.
Challenges of Operating a Grocery Retail Operation
A lack of dependable or consistent air transportation is the most pressing concern of retailers in the North. Keeping shelves stocked when aircraft are grounded due to weather is a frequent issue. Compounding the delays is that spoilage becomes a real concern while grounded on an intermediate leg of the trip. There are occasions that, when the air resupply does arrive, much of the load must be discarded. As one manager noted, in the South, if your shipment does not arrive, you get on the phone and another truck gets it there, sometimes within a couple of hours. This individual reported that his store had not received any new product for a week.
Resupply is a challenge, and the seasonal nature of those challenges magnifies concerns. The main effort revolves around maximizing the use of the lowest cost mode. That usually means minimizing the use of air. Moving as much by sealift, seasonal road or ferry is the objective, leaving the least possible amount to be moved by air. Complicating these efforts has been the reported increase in the share of perishable or time-sensitive goods. The result has been that, for the most part, the seasonality / resupply decisions at the macro level are handled by head office logistics staff, although in some cases the store managers are heavily involved in the process.
The Northern Store managers interviewed described the ordering and inventory management system used when ordering product(s) for their stores. In addition to cost and volume figures, the system also includes available Best Before Date information. This was said to be invaluable in helping the manager order the appropriate amount of stock to be consumed in a given time frame.
Awareness and Impression of the NNC Subsidy
Awareness of the NNC Subsidy
Awareness of NNC among the shopper focus group respondents ranged from vague to non-existent. In many of the discussion groups with consumers, there was no awareness of NNC at all, even after repeated probes from the moderator. In some communities, a few people had heard of it, but only a couple of individuals actually knew how the Program was structured or what products the subsidy applied to.
In Garden Hill, MB, individuals more active in placing personal orders expressed a higher degree of awareness of the Program.
Among community professionals and local government officials, awareness of NNC was somewhat higher, ranging from superficial to good. Nurses are better versed with the Program, but they mainly point to NNC as one of the secondary tools in solving nutrition challenges in the North. Once the Program was explained by the moderator in some detail, a few people recalled seeing signage in the stores and a few then recalled that the subsidy was referenced on their grocery receipt. However, some suspicion was voiced by several individuals as to whether they really did receive the subsidy from the store.
"The price hasn't really changed much, so it doesn't really affect anything. If people noticed a price change because of NNC then I think (they would) start leaning towards looking at (NNC products). A lot of the things that seem to go on NNC are things people don't buy that often."
The lack of consumer awareness could, to some degree, be attributed to how the various store managers were communicating the presence of the Program in their stores.
A retailer registered in the NNC program must undertake a certain level of in-store communications regarding the NNC program. According to the Nutrition North Canada Program National Manual for Program Recipients and the NNC retailer application form, the following is required of registered retailers:
- Must agree to make the Program visible and the subsidy transparent to consumers through messages on cash register receipts and communication material, in-store signage and displays provided by AANDC.
- Must agree to support nutrition education activities in local stores by working with community lay workers and health professionals funded by Health Canada.
In the communities visited, all retail stores registered with NNC were communicating in some form the presence of the subsidy on products. There was some discrepancy from store to store, however, in terms of how information about the Program was being displayed and eligible products identified. That is, there was evidence in some stores of the development of independent promotion products beyond the required materials provided by AANDC. There was no consistent regional pattern in communications efforts.
Typically, communications in the store consisted of wall posters near the entrance, identification (NNC) on the sticker price (for Northern Stores) and shelf-talkers.


Some shelf-talkers were more effective as they actually showed what the product price would be without the NNC subsidy (see above). It did the calculation. These more detailed shelf-talkers were only observed in northern Manitoba and Ontario communities.
Stores belonging to a larger chain, particularly the Northern Store, appeared to do a better job of providing information. Information regarding the NNC program among independents was quite sporadic, keeping in mind that only retailers registered with the program are subject to requirements to make the subsidy visible.
A number of factors contribute to a low awareness of the NNC program among local residents.
- Based on conversations with consumers, the impact on their grocery budgets of the Program's subsidy was perceived as negligible as it did not demonstrably affect their budget. As a result, it was not something they looked for when shopping.
- Confusion with other regional northern food subsidies in place affected the awareness of the NNC subsidy. In Nunavik and Labrador, there are provincially or regionally administered programs which have been in place longer and are therefore better known.
- In Nunavik, the Kativik Regional Government recently expanded the Food and Other Essentials Program which provides a 20% to 40% discount on a list of essential household grocery items. Some items, such as fresh produce, are also subsidized through NNC, while other items are not. In the Quaqtaq, QC Co-op, the subsidy impact on some products was visually more prominent compared to information on the NNC program.
- Transparency concerns was another factor that limits the awareness of the NNC program. In many communities, local government officials that were interviewed expressed strong concern regarding how the subsidy was being applied in their store(s). From their perspective, the subsidy was not being passed on and their repeated questions to the store have not been addressed satisfactorily. In these instances, awareness of the Program among local officials was good; however, their questions regarding how it was being applied in their community made them less likely to promote the program to the local population.
- The inconsistent application of the NNC subsidy because of the transportation options into the community. In Aklavik, NT and Rigolet, NL, there were periods during the year (winter in Aklavik and summer in Rigolet) where the most efficient means to transport some NNC-eligible items was by ground or water (therefore not NNC-eligible). Also, complicating this was where the subsidy was being applied. In some cases, wholesalers in the South were supplying the NNC-eligible product and applying the subsidy at their end. In these cases, the store was not responsible for applying the subsidy. This meant some local stores who are not registered with the NNC program but who may be accessing NNC subsidized products from a registered southern supplier do not have to provide the same level of communication to its customers.
While awareness was low about the Program and some questions existed regarding it being passed on to the end consumer, there was also generally good support in the intent and structure of the Program among consumers. Consumers, community officials and support workers supported the concept of a system that subsidized retailers' efficient transportation of healthier food options.
Impressions of the NNC Subsidy
NNC administers a retail subsidy to encourage delivery of nutritious food to northern communities in an environment where shoppers generally lay the blame for high prices at the feet of transportation (and "greedy companies"). In the interviews, efforts to suggest that transportation costs are only one of a number of factors contributing to high northern food costs tended not to resonate with shoppers.
Despite efforts by NRG Researchers to delve into the complexity of the supply chain, there is no perceived connection between higher operating costs for 'Brick & Mortar' in the North and the price of buying in the North as opposed to outshopping. The problem of grocery costs is primarily...
"Greedy companies …because I know the price of my food mail (on-line shopping), and the price that it is to get it here, and then you go to the Northern and its double from what my food mail price is … are they packaging it in gold at the Northern?"
This blunts the perceived benefit of the NNC subsidy, because even with a high subsidy to retailers, the net effect on the price of NNC-eligible items is eroded by other cost components that are also high and contributing to the overall cost of that product.
There is an assumption by many residents that the NNC subsidy should make it possible to have southern prices in their local store. For example, the subsidy should make up the difference of ferrying or flying in the grocery product. Given that prices are higher than in the South, community members are suspicious as to whether or not the store is passing on the subsidy to the consumer.
"If you walk around the store and see they have little tags with the Nutrition North prices, it's always like 10 or 20 cents cheaper than what the original price was, so where's the rest of the (savings)?"
If a subsidy is applied and only reduces the prices by, in some cases, a few cents, customers may assume the store is not fully passing on the NNC subsidy. This consumer perception underscores the need for continuous communication regarding the NNC program and the rationale for the subsidy levels. The impact of the subsidy on the shelf price of an item is related to:
- the community for which the product is purchased;
- the actual weight of the item; and,
- whether it is a Level 1 or Level 2 NNC- eligible product.
The NNC subsidy is applied on a per kilogram basis and, in some cases, NNC-eligible items may only weigh a few hundred grams. Level 1 subsidies in Full Subsidy communities range from $1.20 per kg in some Northern Manitoba communities such as Gods River and Little Grand Rapids to $16 per kg in Grise Fiord, NU. The median Level 1 subsidy rate for the 84 Full Subsidy communities is about $2.60 per kg, which is the Level 1 subsidy in Fort Severn, ON. During store visits in Fort Severn, it was noted that a 283 ml. can of concentrated frozen orange juice was pre-subsidy priced at $3.96 and the NNC subsidy of $0.80 was reported on that can of frozen concentrated orange juice. Given a total package weight of about 300 grams, that appears to be the appropriate subsidy but, due to low product weight, the price reduction in nominal terms may not appear dramatic.
It appears consumers do not always take product weight into account when assessing the impact of the NNC subsidy. Anecdotally, a few consumers that took part in interviews suggest that items such as fresh fruits and vegetables had the greatest observed savings since the introduction of NNC, perhaps consistent with those products' Level 1 status and their tendency to be sold in larger weights than some other Level 1 products.
Perceptions that subsidies are not being fully passed on may be more frequent when the discussion moves to Level 2 products. Level 2 subsidies in Full Subsidy communities range from $0.05 per kg in some northern Manitoba communities such as Gods River and Little Grand Rapids to $14.20 per kg in Grise Fiord, NU. The Level 1 subsidy rate for Grise Fiord is 57% higher than for the second ranked community, Resolute, NU. For Level 2, the gap is even greater, with the Grise Fiord subsidy rate being 69% greater than that for Resolute, NU.
The median Level 2 subsidy rate for the 84 Full Subsidy communities is about $0.80 per kg., but 30% of the communities have a Level 2 subsidy of only $0.05 per kilogram. In the case of items eligible for a Level 2 subsidy, the impact of subsidy saving to the shelf price can be relatively small, particularly in communities with lower subsidy rates.
Based on discussions, scant allowance is made by local residents for the share of the price difference that is attributable to other costs of operation in the North (fuel, labour, shrinkage, etc.).
Generally, respondents in the focus groups did not report that NNC had generated any shift in their purchasing patterns. That said, they did respond positively to the idea of a program that was intended to make it cheaper to access healthier foods.
Retailer Impressions of NNC
Retailers are generally receptive to the NNC program, and perceive it to be providing a measurable benefit in supporting the delivery of nutritious foods. Awareness of the program among Northern Store operators is very good, as it is with Co-op managers. Some of the smaller chains or individual stores are still adjusting to NNC procedures, and several stores are not participating in the program at this time.
Retailers have stated that the NNC mandate is clear – supporting the delivery of nutritious foods. They have also indicated that the process is efficient. The program allows retailers to work directly with carriers in an effort to make supply chains more efficient.
In some instances, store managers have applied further subsidies on some items. One manager reported selling 4-litre jugs of milk below his store's cost. He was using margins on other non-food items in the store to support the sale of this NNC product. While laudable, this is only possible if sales of non-subsidized items are sufficiently strong to support this strategy.
Health & Nutritional Awareness – NNC and its Role
In all the communities visited by NRG Researchers, local residents believed they did not have a good understanding about what foods are healthy, nor how to prepare meals in a more healthful way. This attitude was most apparent in the far northern regions of Canada, including Nunavut, NT, Nunavik and Labrador. From discussions, it was clear that many individuals held to the old assumption that if the stores sold it, "it must be good for you." As the selection and variety of items offered in stores has increased over the years, this is clearly not the case. Interviews with community shoppers express this sentiment clearly,
"When the stores first came here, Inuit never thought of anything as bad for you. You lived off the land. Everything you ate was good for you. There wasn't going (to be something) to make your teeth rot out of your head – not going to give you diabetes. So when the stores came and its food, who was to tell them that's not healthy for you? So, parents not knowingly were feeding their children unhealthy foods…"
"Health Canada should do more labeling in Inuktitut for Elders."
"For Elders, NNC (nutrition) labeling is like staring at a blank wall."
"When we (Elders) go to the store, we can't differentiate between is this good, is this bad."
With deeply rooted misconceptions such as these, it is not surprising that healthy living education or courses on food preparation sometimes fail to gain traction.
The barriers to expanding the food and nutrition options for northern communities are extensive, and in some regions grounded in cultural traditions and norms of the households. For example, one nurse in a Nunavut community described the situation where many households operating with a traditional country food diet supplemented by convenient frozen dinners, a large number of cooking utensils are not needed. The nurse pointed out that in this situation, "There's no use teaching someone how to cook if they don't have pots."
When the NNC program was fully explained and discussed residents became aware of the connection between healthy eating and the NNC program. Based on the group discussion with residents and community professionals, the association is based primarily on the inclusion of the name 'Nutrition' in the program title and less on the actual program affiliation with Health Canada.
Health care workers are an important source for communicating healthy eating. Programs (such as NNC) designed to reduce the costs of nutritious foods are perceived as a useful step, but the nurses, educators and local government officials universally indicate that it is only part of the answer in encouraging healthier eating among northern residents.
Across the ten communities included in this study, NRG Researchers received feedback of a wide array of different healthy eating and food preparation education programs provided to residents. Following is a sampling of these efforts:
- Meal prep courses at Arctic College in Igloolik and Arviat, NU.
- Meal preparation course for pregnant women in Quaqtaq, QC.
- Life Skills or Home Economics curriculum are common in Nunavut high schools.
- Community centre staff in Puvirnituq, QC hosting monthly food shows to demonstrate ways to cook healthy.
- Diabetes Education programs are quite active in Northern Manitoba and Ontario communities of Lac Brochet, MB, Garden Hill, MB and Fort Severn, ON .
- In Fort Severn, the local government hired a nutritionist themselves (separate from Health Centre) to visit the community every 4 to 6 weeks to provide cooking classes and talks regarding healthy eating tips. This individual has made a particular effort at engaging men in learning about cooking and healthy eating.
- Numerous after-school healthy cooking and eating programs conducted by Health Centre dieticians for school age children.
- Activities by non-governmental organizations like the Food Security Network (present in Rigolet and Iqaluit) promote hunting, gardening and cooking programs during tours through various regions.
Meal programs in the schools are important, as it was reported that a great many children in the schools regularly skip meals. Uptake of meal programs in the higher grades is more uneven, and not always offered. In Rigolet, NLand Lac Brochet, MB, the educators interviewed were fairly active shoppers outside the community who had expressed intent to bring in supplies in an affordable manner so the school could provide a regular breakfast program for its students. In all the communities it operates, the Northern Store provides supplies to the schools' breakfast programs at a reduced cost—usually 15% to 20%.
Outshopping
For the purpose of this study, outshopping is the act of shopping / purchasing items from retail or wholesale sources (on-line or in-person) located outside the local community store.
In order to shop for goods outside the community, two factors must consistently be in place:
A reasonable level of disposable income and/or access to credit. As previously discussed, many residents of these communities are not well off economically and much of the population is on a fixed income – government income support system. Access to capital to make a significant upfront grocery purchase, along with the costs of a return trip from the community, if outshopping, can be a challenge.
Reasonable and moderately affordable access out of the community. Based on this examination, communities that have winter road access or regular ferry service to a better served community (i.e., all weather road) are more likely to be shopping for groceries outside the community.
Residents provided two reasons for shopping outside the community: to save money and to access a broader and better selection of quality products. After some discussion, some residents acknowledged that shopping outside the community was not always a big money saver after shipping costs were taken into account, but even a small saving helps the household budget and a greater selection was still attractive.
"Physical" Outshopping
The act of physically leaving the community to outshop is more common in communities that have an affordable transportation option to leave the community. This is most likely to be a winter road, except for communities such as Rigolet, NL, which have regular summer ferry service. In the far northern regions, travel outside the community is expensive and generally limited to transplanted southerners or local government officials. As a result, in the more remote communities (Nunavut), a large segment of the population does not shop outside the community.
In Nunavik, outshopping has been 'institutionalized' due in part to the James Bay Northern Quebec Agreement, which provides residents a limited number of subsidized trips out of their community.
When the travel outside the community is by air, the outshopping volume is relatively small. Regional airlines have passenger weight restrictions in terms of how much personal cargo they allowed before being charged additional freight costs. This amount is usually in the 30-35 kilo range.
Travelling outside the community by air is expensive (unless subsidized) and therefore not often chosen just for shopping purposes. Usually, the shopping occurs when air travel out of the community is required for another reason—medical or business. On these trips, some form of grocery and merchandise shopping almost always occurs and is brought back into the community.
A broad range of items are usually purchased, including some grocery items, but also a significant amount of household cleaning products, some linens and clothing. A few people mentioned they are somewhat limited in the amount of grocery products they could bring back because of a lack of storage space in their homes (primarily for dry and packaged goods).
In two communities (Aklavik, NT and Rigolet, NL) local residents identified two additional methods of accessing groceries from outside the community. In these communities external suppliers will physically visit the community, either by truck via winter road (Aklavik) or by ferry (Rigolet) loaded with meats or fresh produce. They tend to visit the community a couple of times a season.
Organized Winter Road/Sealift Outshopping
The annual resupply effort into the community is a common way to receive goods.
In Nunavut and Nunavik, companies sell crates to individuals to transport into the community on the sealift resupply ship. From comments gathered in the community as well as interviews with suppliers, some of these customers tended to be transplanted southerners. Part of the reason for this was the upfront cost to fill a large crate with grocery and household items.
Fort Severn, ON, is an example of where a well organized outshopping regime is in place. Forty people are offered space on an in-bound semi-trailer that travels to the community from Winnipeg. The local government has established a process whereby individuals are able to order from a list of selected suppliers (Costco, Canadian Wholesale, etc.,) who have provided a pricing list of products available for purchase (mostly dry goods). Residents are required to spend a minimum of $1,000 per order (some individuals recruit other families to help fill up their order). In addition to the $1,000, residents must pay the freight—approximately $300 per person.
The local government in Fort Severn, ON has also financially supported a winter road outshopping trip specifically for Elders. This is a free service for Elders to get them a stock of essential grocery items: flour, sugar, salt, cooking oil, cereals, etc.
On-line Outshopping
Another form of outshopping is done online. This is fairly common and usually involved the purchase of non-grocery items such as electronics, media such as DVDs, games, books and clothing for both adults and children. This practice seems to be prevalent all year long.
For the internet shoppers, there may be some push-back in the future when it comes to extensive ordering from the South. In the past, retailers such as Wal-Mart, Amazon and Best Buy routinely offered "free shipping." More recently, however, the retailers have begun to notice the true cost of shipping to the North, and shipping charges are now being applied in a greater number of cases. This may soon become a universal practice.
NNC Direct / Personal Order Outshopping
As mentioned earlier in this study, there are 18 NNC registered southern suppliers that provide direct orders to northern residents. These NNC registered southern suppliers sell both subsidized items and non-subsidized items. A customer (individual, social institution, establishment or small retailer) may connect with a NNC registered southern supplier such as Harris Meats, Arctic Buying Co. or Marché Central du Nord, and place an order. The company fills the order and ships it to the community by air. These companies offer the appropriate subsidy rate on eligible items.
Based on the information gathered in the ten communities included in this study, there is no consistent pan-northern approach to the direct order business. Evidence suggests that direct order companies in the South focus on specific regions and communities and have established relationships with transport companies.
Direct order sizes varied, but were typically never less than $100 and could be as high as $500 a personal order. It should be noted that this amount included both NNC-eligible and ineligible products.
Based on the NRG Researchers' interviews, the more regular direct / personal order user in the Northwest Territories, Nunavut and Nunavik tended to be a transplanted southerner working in the community as opposed to an indigenous resident. In Nunavut and Nunavik, some of these individuals indicated that as part of their employment package they are able to ship groceries from the South and have the freight costs covered. This encouraged increased regular direct personal order consumption. In Northern Manitoba and Ontario, the incidence of locals using direct personal orders is much higher and more on balance with the usage by southerners.
In Arviat, NU, some retailers have begun to develop outshopping portals for residents either who may not be outshopping literate or may simply want to take advantage of the retailers' knowledge of the system. North West Company's Valu Lots is also a southern supplier registered with NNC to offer these services.
Perceptions of Outshopping
Retailers in the North, particularly those that do not facilitate on-line orders for their customers, perceive the practice of shopping outside the community as having a somewhat detrimental effect on their community-based operations.
In Nunavut-based operations, physical outshopping appears to be viewed somewhat neutrally, but the growth in the market involving southern-based personal order operations is somewhat of a concern. The opposite is more likely in parts of the North with winter road service. In these communities, the level of physically shopping outside the community was noticed more so than the personal orders.
When managers and head office staff of NNC registered retailers were asked what they are doing to address this, the response was: looking to maximize efficiencies along the entire supply and logistics network in order to provide its customers the best price possible.
While 'Brick & Mortar' stores provide employment to the community, and may provide other services to the community, residents appear to have no concerns about outshopping. Despite repeated questions about the effects on local businesses, there was little concern given to the possible consequences for local retailers.
Country Foods
Country foods, the collective bounty from hunting and fishing, are an integral part of diet and society in the North. Community members almost universally embrace the importance of country foods to their communities, and want the practice of collecting and distributing country foods to continue as a significant part of their culture. In the groups, all participants indicated they would like to be able to increase their consumption of country foods. In most communities included in the study, individuals mentioned a particular preference for caribou.
While there is a strong wish for a healthy country food component, some respondents indicated country foods are not as plentiful or common as they had been in the past. One challenge is there are natural fluctuations in caribou herd sizes.
Respondents in Igloolik, NU, Rigolet, NL and Lac Brochet, MB were the most likely to cite these concerns. Respondents in Rigolet, NL, pointed out that a current caribou hunting ban has had an effect on the mix of animals hunted or trapped as country food. In Igloolik, respondents indicated much of their caribou and arctic char is being shipped in from the Kivalliq Region. Lac Brochet, MB residents said that forest conditions last year around the community have meant the caribou is further away than normal and more difficult to hunt.
Some government representatives in Arviat, NU said the Kivalliq appeared to be in a reasonably good position at present to serve its needs for country foods and had supported exports to the Baffin in the past. Aklavik, NT also appears to have good access to caribou and other game at present. However, there have also been reductions in allowable caribou harvests in some areas in recent years.
In Nunavik, while country foods are important and sought after, many residents said it is also getting expensive to hunt. This, along with the fact some younger residents are showing signs of losing interest in the practice of hunting, is a concern.
In Garden Hill, MB, fishing is popular among some locals, but a noticeable number of people did not make an effort to obtain any country foods. In Fort Severn, ON, country food is a major part of the local household diet. There is an abundance of different game—geese, caribou, small game and fish—to keep freezers well stocked.
Some communities maintained a community freezer that stores local wild game and distributes to people in the community. In these communities, an effort is made to ensure seniors and households dealing with diabetes received a share of wild game. The allotment is free. In Rigolet, NL, hunters are supported financially in terms of a small stipend to cover some of the costs associated with harvesting the game. This did not appear to be the case in other communities however.
At present, a large segment of country foods are generally handled outside the formal retailing structure of the community. The hunter, once his/her household is looked after, may take any surplus to friends or relatives' households to sell, barter, or share. Alternately, the surplus may be shipped to other communities or sold through the retail food system in the community. If the latter, the expectation is that country foods first meet Canadian Food Inspection Agency standards by inspection through Canadian Food Inspection Agency approved facilities. The Canadian Food Inspection Agency inspection adds time and cost to the process but is in place to ensure food safety. A Nunavut Government staff member pointed out that the level of Canadian Food Inspection Agency involvement varies, depending upon the distribution and destination of the country food. As he indicated, in some instances "CFIA doesn't come into it." However, concern remained with many residents that when country foods were available in the local store, it was usually almost as expensive as southern meats and therefore not as accessible to all households.
Within a community, access to country foods is not universal. Some households do not have a snowmobile (standard equipment for modern hunting in the North), or anyone in their household who has been taught the skill set. In these instances, the household depends on surplus from other households or purchase of government inspected product at the stores.
With poverty levels being a significant concern, and the wish to reduce food insecurity, the use of country foods could be seen as a tool to reduce some pressure in these areas. The opportunity for households to extend their food budget is quite real, and country foods, by their nature of being sourced from within the region, are somewhat insulated from transportation cost impacts (although modern hunting generally uses snowmobiles which have a southern-sourced fuel component). Also, the shorter supply chain may be less vulnerable to weather delays and other challenges associated with air or sea travel in the North.
Overall, across the communities included in this study, country foods are not items that are stocked by northern retailers to a large degree. Retail operations in the communities of Arviat, NU, Igloolik, NU, Iqaluit, NU and Aklavik, NT have begun bringing country foods into their stores. Northern Stores in Arviat and Igloolik (and NorthMart in Iqaluit) had prominent chest freezers with arctic char. The char sells for about $17 per kg, which is quite a bit higher than the cost residents in the area would pay. The char is reportedly routed through the Canadian Food Inspection Agency and /or territorial inspection and is not necessarily local char.
Some local independent retailers expressed frustration of not being able to sell any local fish in their store because of Canadian Food Inspection Agency and Freshwater Fish Marketing Board rules. It was clear from retailer comments that the Canadian Food Inspection Agency and/or territorial inspection processes is perceived to increase the cost of selling country foods in local stores as well as complicating the process of getting the product to the store for sale.
In many northern locations, local governments maintain community freezers to which local hunters could donate (or in the case of Rigolet, NL, be provided a small stipend) wild game. The presence of these freezers or the abundance of game in general, further diminishes the likelihood of country food being sold in the local store.
Expectations and Role of 'Brick & Mortar' Retail Operations
The following discussion revealed the greatest disconnect between the opinions expressed at the shopper focus group level and at the retailer level.
Local Resident Impressions
Local residents were asked to assess the role, if any, of the local stores beyond simply where one goes to buy food. Respondents clearly perceived the need for the retail outlets, yet appeared to have no loyalty or affinity for the stores. This was the case even with the Co-ops, although members acknowledged that dividend cheques were sometimes associated with membership.
There were mixed feelings about the stores' roles in the community. Generally, they are perceived as being there just to make money. In the case of the Northern Store, respondents often added the comment that the profits left the community for the South, or, according to a few individuals in one community, to support the retailing operations in less profitable communities.
Among the ten communities visited, these views did not vary by region or whether the community was served by only one grocery store or had multiple retail operations available.
The Co-op and the Northern Store receive positive feedback from their support of community events, but the credit does not appear to be long-lasting. One endeavour that had some staying power appeared to be the Co-op's program, whereby members with health issues (and family members) that travel to the South are aided financially during their stay out of the community.
The Northern Store reports financially supporting the elementary and high school breakfast programs in all communities in which it operates. Educators were appreciative of this support, but residents rarely mentioned this activity as an example of the store's support of the community.
In addition, there was some sporadic recall in a few communities of Northern Store's support for providing scholarships to graduating students. Awareness of this activity was higher in small (population size) communities, compared to larger communities.
In Rigolet, NL, a community with only one store, the store was acknowledged to be a community social hub where residents had an opportunity to run into others in the community. In addition, the store served as a communication source for posting information as almost everyone passed through its doors each week. One aspect evident when visiting the main retail outlets was that, regardless of what residents thought about the store, if there was anything of note happening in the community, notice of it was posted on the bulletin board provided at the entrance of the store.
Retailer Impressions
Co-op managers express confidence in the Co-op model in which the community owns the store and therefore the success of both parties are inextricably tied. In the consumer groups, even among shoppers with a Co-op number, little evidence exists to support this assessment. These individuals do not express a sentiment that they have a stake in the success of the Co-op store. These individuals do however look forward to the annual Co-op cheque. They also speak well of programs to support residents that have to travel to the South for health reasons, but they do not see themselves (or at least speak as if they are) as shareholders of their company.
Northern Store managers, as a group, acknowledge that they have somewhat more work to do in comparison to their Co-op counterparts in terms of establishing a positive reputation in the community. This was an acknowledgment that as a private company they do not have the same community connection some Co-ops may have. These managers stated that they are working diligently to connect with the community and show the residents that Northern Stores are committed to the community they serve. As mentioned in an earlier section, residents do acknowledge their efforts towards community involvement (albeit briefly), but the thought of the Northern Store being an important part of the community appears somewhat foreign.
The conversation with store management in one community identified a challenge outshopping presents, both to the 'Brick & Mortar' operations of the retailer and to some members of the community who are unable to outshop. In the group discussions, several references were made to buying all the household's school supplies outside the community. The rationale for this was that selection was much greater in stores outside the community and the prices are better. Several comments were made to the effect the local store hardly stocks any school supplies.
A visit to the store and follow-up conversation with the store management revealed that the store does not stock a lot of school supplies and rarely ever does. However, management did make the point that they used to stock more supplies but much of it went unsold. When this happened, the next year the store ordered fewer school supplies, eventually getting to the current situation where very few school supplies are now carried. The manager acknowledged that there really was not much point in stocking school supplies—"Everybody outshops for them." When asked, the manager did not know what people in the community (who could not shop outside the community) did in order to obtain supplies.
Retail Store Manager Survey Results
NRG Research Group conducted an online survey with a sampling of grocery store retail managers. All grocery retailers in NNC-eligible communities (approximately 131) that could be identified were contacted to conduct an online survey. The online survey with store managers achieved a participation rate of about 75%.
A more detailed examination of the methodology and source data is included in Appendix 2.
Summary of Store Manager Survey Findings
Profile of Managers and Stores
From the information gathered from the online survey, the typical manager of a grocery store in an NNC eligible community is a non-aboriginal male between 35 to 54 years of age. The individual has likely been in the position of manager for five years or less, with a significant number having less than two years experience. However, it is likely the individual has held other positions in a northern retailing grocery operation, so there is a higher level of general managerial experience than simply the number of years as manager.
The stores are staffed predominantly with part-time employees drawn from the local community and full-time managerial positions filled from outside the community. This case is the strongest in Labrador, Manitoba, Saskatchewan, and Nunavut. Local hiring for managerial positions is occurring at a lesser rate in Quebec and Northwest Territories and Yukon.
On average, stores employ a staff of 20, with 9 of these positions being full-time. On average, Nunavut is home to larger stores, having a complement of up to 29 full and part-time staff.
Just under half of the managers surveyed (49%) said they had prior grocery retail experience in a southern market. The majority of managers with prior southern retail experience said this experience was beneficial to their managing a store in a northern setting.
In terms of product mix in the stores, about three-quarters of the stores' retail floor space is devoted to grocery (food) items, which almost always includes fresh produce, dairy, frozen foods, bakery items and dry food items. Fresh meatFootnote 10 is the one product that is often not an item stocked in some stores. Fewer than half the stores (49%) said they carry fresh meat. Access to fresh meat through a grocery store was highest in Labrador and Manitoba and Saskatchewan and lowest in Nunavut, Northwest Territories and Yukon stores. Virtually all stores stocked frozen meat.
Over half (60%) of managers said they did not stock country foods. Stores that did stock these items tended to be located in Nunavut (80%) or Nunavik (50%) and typically the local food sold was fish. Managers that sold country foods said it made up less than 5% of their food product volume.
Managers stated that they are receiving reasonably good air freight service. Almost half of the stores (49%) reported being resupplied by air a minimum of four times a week, with the balance (46%) being resupplied by air at least twice a week. Nunavut communities receive the most frequent service with air, 72% of managers saying they receive at least four resupply flights a week. Manitoba, Saskatchewan, Labrador and Quebec have the most infrequent level of air service.
In terms of the competitive environment, 80% said there is another grocery retailer operating in the community where they are located. In Manitoba, Saskatchewan, Ontario, Northwest Territories and Yukon, this is generally an independent operator. This tended to be a regional chain in Quebec, and communities in Nunavut were most likely to have both major northern retail chains (Northern Store and Arctic Co-op) present.
Retailing Challenges & Experiences
From a managerial perspective, staffing/HR issues followed by store equipment and maintenance are the most challenging aspects of running a store in the North. Another important challenge surrounds identification of spoilage and damage and the ordering and purchasing of inventory.
Managers who had prior experience working in a grocery retail store in the South said the greatest difference between the retailing environments are:
- HR and staffing, specifically reliability;
- Inventory management, specifically resupply times, frequency and weather interruptions;
- Product availability and price; and,
- Store and equipment maintenance, specifically costs.
Managers perceive their store to be doing a reasonably good job serving their respective community in terms of grocery product selection, giving themselves an overall rating of almost 7 out of 10 in terms of their performance in this area. Managers feel their store is well received in the community from a reputation perspective (overall rating 7.6 out of 10).
When managers were asked what they thought would have the greatest impact on reducing the costs of the groceries they sell, a strong majority (73%) said it would be to reduce freight rates.
Shopping Outside the Community
Store managers from Manitoba, Saskatchewan, Ontario, Labrador, and to some extent Quebec were most likely to indicate the incidence of shopping for goods outside the community is more common. Managers said people are doing this to save money and to increase the selection of goods available to them.
Managers are of the view that professionals working in the community—teachers, healthcare workers and workers transplanted from the South—are most frequently shopping for goods outside the community. This said, there is also a fairly strong perception that many local residents are shopping for products outside the community as well.
Sample Profile
Ninety-eight store managers participated in the region wide survey conducted by NRG Research Group. Following is a demographic profile of the sample:
| Attribute | N=98 | Attribute | N=98 |
|---|---|---|---|
| N=98 (where n=number of respondents) | |||
| Gender | Age | ||
| Male | 79% | 25-34 | 9% |
| Female | 16% | 35-44 | 28% |
| Declined | 5% | 45-54 | 36% |
| 55+ | 25% | ||
| Declined | 2% | ||
| Province/Territory | Ancestry | ||
| Labrador | 5% | Non-Aboriginal | 74% |
| Quebec | 20% | Inuit | 11% |
| Ontario | 13% | First Nation/Métis | 6% |
| Manitoba | 12% | Other | 3% |
| Saskatchewan | 4% | Declined | 5% |
| Nunavut | 34% | ||
| Nortwest Territories | 10% | ||
| Yukon | 1% | ||
Conclusions
In the North, business operation costs, including those for food retail operations, are very high. While direct transportation is often cited as the major element contributing to those costs, it is only one of a number of aspects contributing to those costs. Other cost drivers affecting food retail revolve around:
- 'Bricks and mortar' - cost of building and maintaining stores in remote communities, in part due to high cost of shipping of building materials, heating and cooling costs;
- Human resource considerations - staffing is a challenge in the North with increased recruitment, training and salary costs;
- Spoilage (losses during transport or suggested Best Before Date expiration) and/or shrinkage (theft) - these losses occur at higher rates than in the South; and
- Much higher inventory costs - the absence of regular, minimal cost resupply forces retailers to "stock up" in expensive near-site warehousing
Transportation has a secondary cost effect on virtually all aspects of the previously mentioned items. It is expensive to move fuel into the North to run generators; housing costs (and by extension, HR costs) are higher in part to the cost of moving building materials into the North; longer supply chains create greater opportunities for spoilage; and seasonal transportation challenges affect storage and inventory requirements.
There is also anecdotal evidence to suggest retailer profit margins may be somewhat higher in the North, but not to the extent that margin differences could account for the retail price differential relative to southern prices.
Incomes in the North vary greatly, with a significant percentage of households being supported by well-paying positions supplemented by northern allowances. In contrast, a large percentage of households do not have access to those support structures. Consequently, a large percentage of the population must spend an excessive percentage of household income on food.
Outshopping (purchasing items outside of the local physical store.) is a common practice for those with access to financial resources and relatively convenient transportation options.
NNC Direct / Personal orders provide an opportunity for northern residents to order items (both NNC-eligible and non-eligible (non-subsidized items) from NNC registered southern suppliers. However, northern residents are generally more likely to purchase perishables and NNC-eligible goods from sources within the community, because the local retailers appear better equipped to ensure quality control on these items.
Outshopping and direct / personal orders provide an opportunity for northern consumers to bypass the local "brick & mortar."
Local residents often turn to country food (wild game) to manage and budget their household grocery needs. However, there are challenges with the ongoing reliance on wild game to supplement northern diets. The desire among young residents (the 'next generation') to hunt wild game foods appears to be diminishing. In addition, the sustainability of wild game in the quantities necessary to support local communities is questionable, given the average population growth rates in the North being greater than for Canada as a whole, and past instances of herds being depleted.
At the consumer level, detailed awareness of the NNC program is limited although others in the supply chain have adapted to NNC.
The NNC program has helped reduce food costs in the North, particularly for Level 1 commodities. From the nutrition standpoint, these are the more desirable components of healthy diets. To fully capture the benefits of the NNC program, strong synergies with other programs and departments, particularly Health Canada, continue to be required.
Appendices
Appendix 1 – Retail Store Manager Survey Findings
Retailing Experience & Staff Make-Up
How long have you been store manager at this store?
How many years have you been involved in other management positions at your current store?

A total of 98 persons responded to this survey
Expand for text description of this chart
Out of 98 respondents, 41 percent have experience as a manager for less than two years while 43 percent have experience in management for less than two years.
34 percent have experience as a manager for two to five years while 31 percent have experience in management for two to five years.
26 percent have experience as a manager for six or more years while 27 percent have experience in management for six or more years.
Experience among managers is higher in the stores in NT(40%, 6 years or more) and Labrador (40%, 6 years or more). Experience is lower in Ontario (54%, < than 2 years), Nunavut (48%) and Quebec (40%, < than 2 years).
How long in total have you worked in retailing in the North?
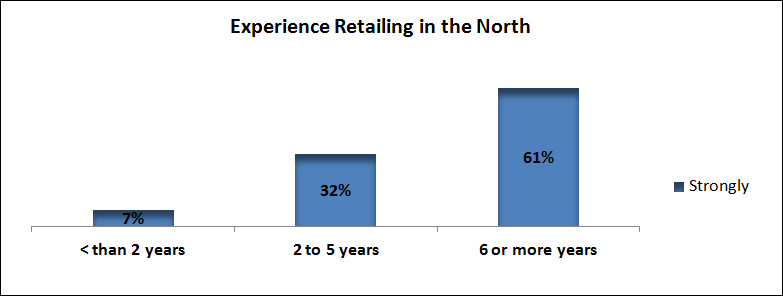
A total of 98 persons responded to this survey
Expand for text description of this chart
Out of 98 respondents, 7 percent of respondents have strongly worked in retail in the North for less than two years.
32 percent of respondents have strongly worked in retail in the North for two to five years.
61 percent of respondents have strongly worked in retail in the North for six or more years.
Noteworthy is that over a third (38%) of current managers with less than 2 years of manager experiences have been involved in retailing in the North for 6 or more. This is an indication of some additional experience with northern retailing in advance of taking over the manager position.
How many employees do you have on staff?
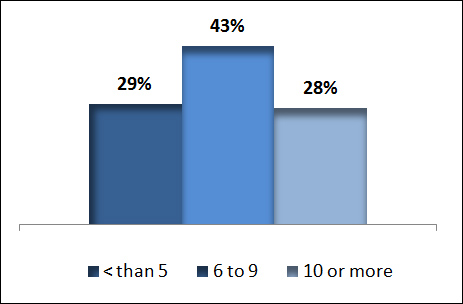
A total of 98 persons responded to this survey
Expand for text description of this chart
Out of 98 respondents, 29 percent have less than five employees on staff, 43 percent have six to nine employees on staff, and 28 percent have ten or more employees on staff.
How many employees are full-time?

A total of 98 persons responded to this survey
Expand for text description of this chart
Out of 98 respondents, 32 percent have less than ten full-time employees, 37 percent have ten to 19 full-time employees, and 32 percent have 20 or more full-time employees.
The mean average number of employees is 20. On average, a store has about 9 employees full-time. Larger stores, employee-wise, are in Nunavut, which on average employ just over 11 full-time people at a store.
What percent of the stores employees are from the local community? Outside the community?
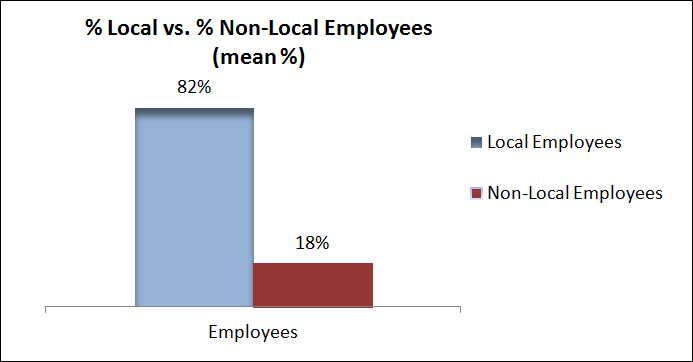
A total of 98 persons responded to this survey
Expand for text description of this chart
Out of 98 respondents through a mean percentage, 82 percent of employees are said to be local while 18 percent are said to be non-local.
The highest incidence of hiring locally was in Labrador (99% local), Manitoba and Saskatchewan (84% local) and Nunavut (84% local).
What percentage of your staff is First Nation, Inuit, non-Aboriginal?

A total of 98 persons responded to this survey
Expand for text description of this chart
Out of 98 respondents through mean percentage, 31 percent of employees are said to have First Nations or Métis ancestry, 50 percent are said to have Inuit ancestry, and 19 percent are said to have non-Aboriginal ancestry.
There are significant regional differences regarding the ancestry of store staff as outlined in the table below.
What percentage of your staff are First Nation, Inuit, and Non-Aboriginal? [BY REGION]

A total of 98 persons responded to this survey
Expand for text description of this chart
Out of 98 respondents through mean percentage, the Manitoba and Saskatchewan is said to have 85 percent of staff as First Nations or Métis, zero percent of staff as Inuit, and 15 percent of staff as non-Aboriginal. Ontario is said to have 79 percent of staff as First Nations or Métis, one percent of staff as Inuit, and 20 percent of staff as non-Aboriginal. Quebec is said to have four percent of staff as First Nations or Métis, 73 percent of staff as Inuit, and 23 percent of staff as non-Aboriginal. Labrador is said to have zero percent of staff as First Nations or Métis, 99 percent of staff as Inuit, and one percent of staff as non-Aboriginal. Northwest Territories and Yukon is said to have 51 percent of staff as First Nations or Métis, 27 percent of staff as Inuit, and 22 percent of staff as Non-Aboriginal. Nunavut region is said to have one percent of staff as First Nations or Métis, 80 percent of staff as Inuit, and 20 percent of staff as non-Aboriginal.
Store Services
Which of the following grocery categories does your store provide?

A total of 98 persons responded to this survey
Expand for text description of this chart
Out of 98 respondents, 97 percent are said to provide fresh produce, 49 percent fresh meat, 98 percent dairy, 99 percent frozen foods, 95 percent bakery items, and 100 percent dry food stuffs.
Fresh meat service varies regionally.
- NT/Yukon – 27% yes
- Nunavut – 42% yes
- Ontario – 46% yes
- Quebec – 55% yes
- Manitoba/Saskatchewan – 63% yes
- Labrador – 80% yes
In addition to groceries, what other services are offered in your store? [MULTIPLE MENTION]
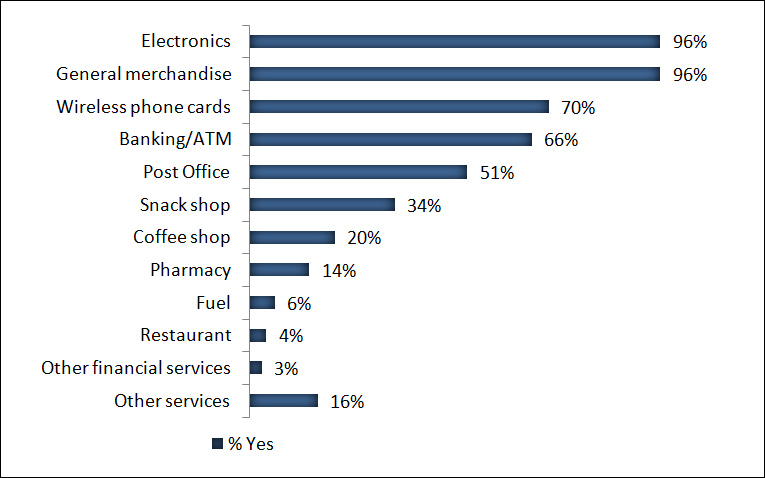
A total of 98 persons responded to this survey
Expand for text description of this chart
Out of 98 respondents with multiple mentions, 96 percent are said to have offered electronics, 96 percent general merchandise, 70 percent wireless phone cards, 66 percent banking or automated teller machine, 51 percent post office, 34 percent snack shop, 20 percent coffee shop, 14 percent pharmacy, six percent fuel, four percent restaurant, three percent other financial services, and 16 percent other services.
Most store managers (85%) say their store product mix is generally stable throughout the year. Only 15% say there are seasonal changes to their inventory mix.
In your store, approximately what is the percent of food vs. non-food items such as general merchandise?

A total of 98 persons responded to this survey
Expand for text description of this chart
Out of 98 respondents, approximately 72 percent of store inventory is food versus 28 percent for non-food inventory.
The ratio of food to non-food inventory is highest in the NT/Yukon area (average 79%, food) compared to a low of 65% food in Quebec.
What is the frequency of your community's air cargo service?
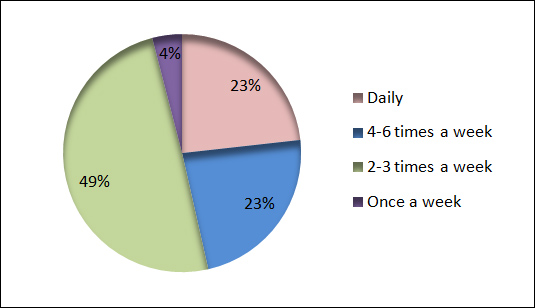
A total of 98 persons responded to this survey
Expand for text description of this chart
Out of 98 respondents, 49 percent have air cargo service to their community two to three times a week, 23 percent have it four to six times a week, four percent have it once a week, and 23 percent have it daily.
Stores in Nunavut, Northwest Territories and Yukon appear to have the best air resupply schedule with over a third of the stores saying they are resupplied daily (Nunavut 36%, Northwest Territories / Yukon 36%). Stores in Manitoba, Saskatchewan, Ontario and Quebec have a lower number of flights servicing their stores with over 50% saying they receive 2 to3 flights a week typically (Quebec 75%; Manitoba/Saskatchewan 69% and Ontario 54%).
Retailer Competition in the Community
Are there any other grocery stores in the community you compete with?

A total of 98 persons responded to this survey
Expand for text description of this chart
Out of 98 respondents, 80 percent have said that they do have competition with other grocery stores in the community while 20 percent have said they do not have competition.
Grocery retailer competition is most common in Quebec (90%, yes), Nunavut (94%, yes) and Labrador (80%, yes). Competition is less likely in Ontario (54%, no) and Manitoba/Saskatchewan (31%, no).
Is the grocery retail competition in your community coming from a major retail chain, regional retail chain or an independent store? [MULTIPLE MENTION]

A total of 78 persons responded to this survey
Expand for text description of this chart
Out of 78 respondents with multiple mentions, 42 percent mention competition from major chains, 36 percent mention competition from regional chains, and 51 percent mention competition from independent stores.
Regionally, any competition in Manitoba, Saskatchewan, Ontario, Northwest Territories and the Yukon is likely to be a result of the presence of an independent retailer. In Quebec, smaller regional chains are more likely to be identified as providing the competition in the community. In Nunavut, larger retail chains are more likely to compete directly.
Country Foods
Does your store retail country foods and if so what types of country foods do you retail?
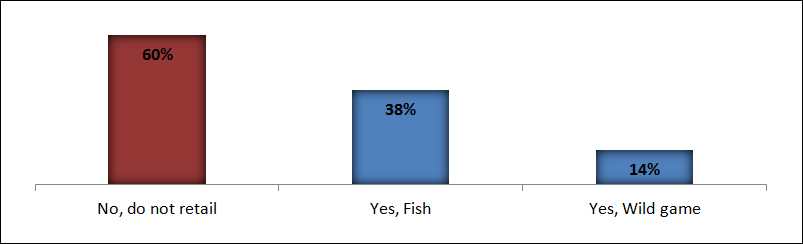
A total of 98 persons responded to this survey
Expand for text description of this chart
Out of 98 respondents, 60 percent do not retail country foods, 38 percent retail country food as fish, and 14 percent retail country food as wild game.
Only stores in Nunavut (82%, yes) and Quebec (50%, yes) one store in Northwest Territories said they retail country foods. The majority do not carry country foods.
According to the stores that retail country foods (N=39), the vast majority said this product category makes up a small proportion of their total grocery product stock (less than 5%). Country food, when stocked, is not a significant grocery item in terms of volume. That said, a third of retailers selling country foods said it was an important revenue source.
A plurality of retailers (44%) who indicated they carry country foods said there is no seasonal variation in terms of volume stocked. About 40% of stores that retail country food said volume varied based on the availability of supply, but not directly a seasonal factor.
Retailing Challenges
In your experience, what is the most challenging aspect about managing a retail store in the North? [AIDED MULTIPLE MENTION]

A total of 98 persons responded to this survey
Expand for text description of this chart
Out of 98 respondents with aided multiple mentions regarding the most challenging aspect of managing a retail store in the North, 52 percent mention staffing or human resource issues, 43 percent mention logistics and freight, 13 percent mention stocking and freshness, six percent mention pricing concerns, and eight percent mention other.
Staffing challenges appear particularly acute among Nunavut stores, where 67% selected this as the most difficult aspect of retailing in the North, and those in Quebec (60%). In Manitoba and Saskatchewan, managers are more likely to identify logistic and freight issues as the most challenging (69% of selections).
Please rate using a 1 to 10 scale, how challenging each of the attributes is in terms of managing your store. The first is [INSERT ITEM]
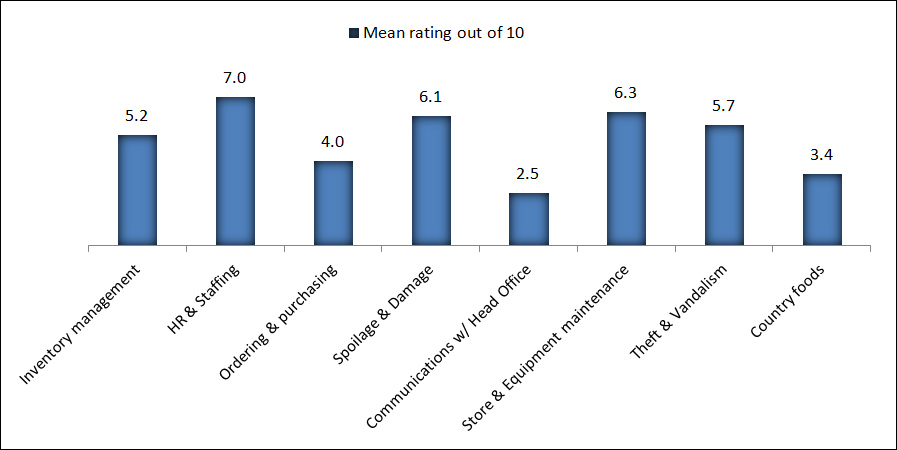
A total of 98 persons responded to this survey
Expand for text description of this chart
Out of 98 respondents on how challenging it is to manage their store and a mean rating out of ten with ten being the most challenging, inventory management was given a rating of five point two. Human resources and staffing was given a rating of seven, ordering and purchasing was given a rating of four, spoilage and damage was given a rating of six point one, communications with head office was given a rating of two point five, store and equipment maintenance was given a rating of six point three, theft and vandalism was given a rating of five point seven, and country foods was given a rating of three point four.
Below are a few noteworthy sub-group findings for the attributes:
Inventory Management (5.2)
- Managers who have worked in a southern retailing situation before (mean 5.6 vs. 4.8 for managers who had not worked in the South before). Perhaps an indication of the differences between southern and northern retailing situations regarding inventory management.
HR and Staffing (7.0)
- Managers from stores in Nunavut (mean 7.6) Quebec (mean 7.5) are somewhat more likely to indicate HR and staffing are a challenge.
Ordering and Purchasing (4.0)
- Store managers from Northwest Territories/Yukon (mean 5.6) were more likely to say that ordering and purchasing are a challenge.
Spoilage and Damage (6.1)
- Managers from stores in Northwest Territories/Yukon (mean 7.0) are somewhat more likely to mention that spoiling and damage are a challenge.
Store Equipment & Maintenance (6.3)
- Store managers in Ontario (mean 7.4) are somewhat more likely to say this is a challenge.
Theft & Vandalism (5.7)
- This is identified as a somewhat greater challenge by managers operating in Manitoba/Saskatchewan (mean 6.3).
Country Foods (3.4)
- Country food is noted as a greater challenge for store managers in Nunavut (mean 3.9). This makes some sense given managers in Nunavut were most likely to be retailing this product (82% of them retailing).
Benefit of Southern Grocery Retailing Experience
Have you ever managed or been involved in a grocery retail operation in the South?
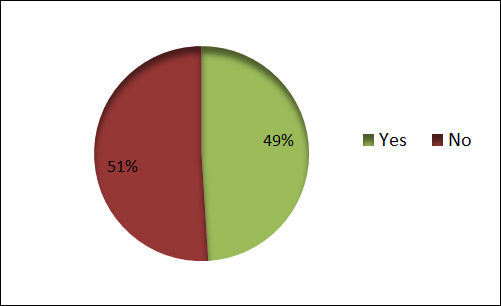
A total of 98 persons responded to this survey
Expand for text description of this chart
Out of 98 respondents, 49 percent said they have managed or been involved in a grocery retail operation in the South while 51 percent said they have not.
Store managers from stores in Northwest Territories/Yukon (73%), and Nunavut (61%) were more likely to have had some southern grocery retailing experience.
[IF PREVIOUS EXPERIENCE] How did this experience prepare you for managing a store in the North?
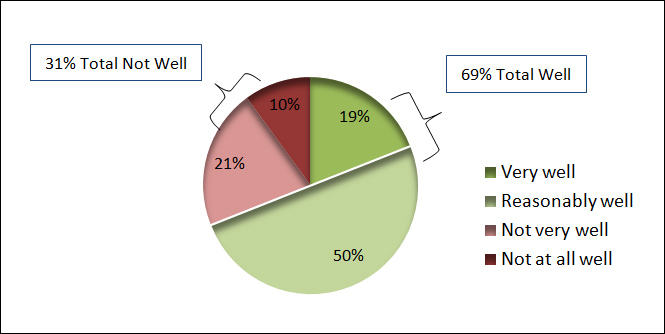
A total of 48 persons responded to this survey
Expand for text description of this chart
Out of 48 respondents who have had previous experience in the South, 50 percent said that it prepared them reasonably well for managing a store in the North. 19 percent said that it prepared them very well, 21 percent said that it prepared them not very well, and ten percent said that it prepared them not at all well. In total, 69 percent responded that it prepared them well while 31 percent said it did not.
Managers provided the following reasons for saying their southern grocery retailing experience did not prepare them well for their current northern assignment:
- Differences in practices—cultural, logistics (67% of mentions)
- Product availability (20% of mentions)
- Availability of staff (20% of mentions)
- Other mentions (33% of mentions)
Please rate using a 1 to 10 scale, how similar or different the following attribute are comparing retailing in the North to the South. '1' means it is very similar and '10' means it is very different. The first is [INSERT ITEM]

A total of 48 persons responded to this survey
Expand for text description of this chart
Out of 48 respondents and on a scale of one to ten with one being very similar and ten being very different, inventory management was given a rating of six point six. Human resources and staffing was given a rating of seven point seven, ordering and purchasing was given a rating of six, spoilage and damage was given a rating of six point five, communications with head office was given a rating of three point four, store and equipment maintenance was given a rating of seven point three, and theft and vandalism was given a rating of five point seven.
What would you say is the one greatest difference comparing retailing in the North compared to the South? [OPEN END WITH CODED VERBATIM RESPONSES – MULTIPLE MENTIONS]
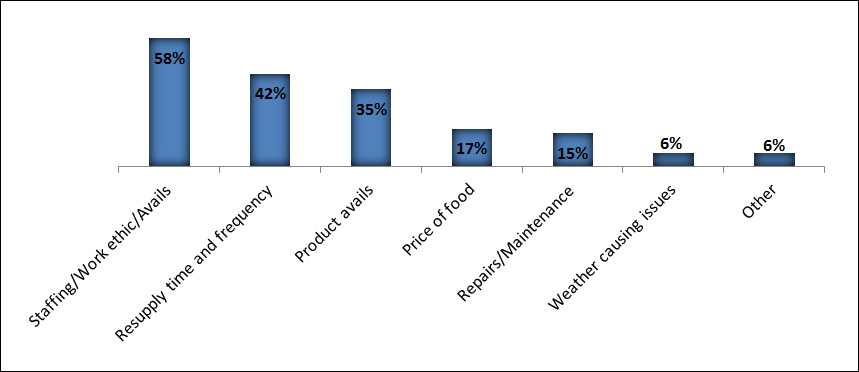
A total of 48 persons responded to this survey
Expand for text description of this chart
Out of 48 respondents with open ended and coded verbatim responses with multiple mentions as to what is the one greatest difference between North and South retailing, 58 percent identify staffing, work ethic, and avails. 42 percent identify resupply time and frequency, 35 percent identify product avails, 17 percent identify the price of food, 15 percent identify repairs and maintenance, six percent identify weather causing issues, and six percent identify other.
N sizes are small to this question, but it appears managers in Manitoba/Saskatchewan are more likely to identify product availabilityas the greatest difference while those in Northwest Territories/Yukon identify staffing issues.
Personal Orders & Outshopping
How prevalent would you say [direct or personal grocery orders/outshopping] are in the community you serve? Is it…?
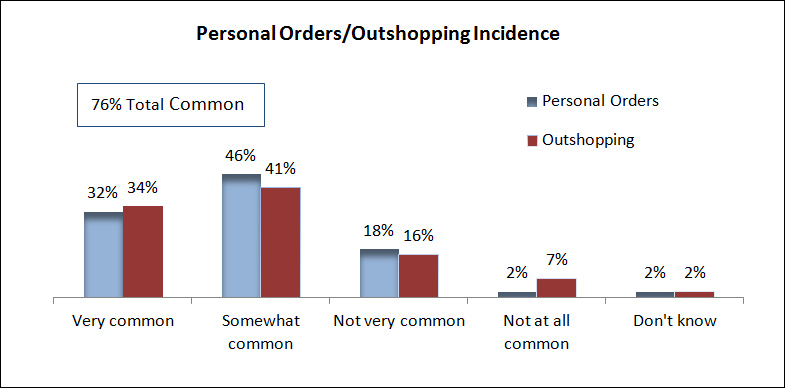
A total of 98 persons responded to this survey
Expand for text description of this chart
Out of 98 respondents, 32 percent identified personal orders as very common and 34 percent identified outshopping as very common. 46 percent identified personal orders as somewhat common and 41 percent identified outshopping as somewhat common. 18 percent identified personal orders as not very common and 16 percent identified outshopping as not very common. Two percent identified personal orders as not at all common and seven percent identified outshopping as not at all common. Two percent responded with do not know for both personal orders and outshopping. In total, 76 percent identified personal orders and outshopping incidence as common.
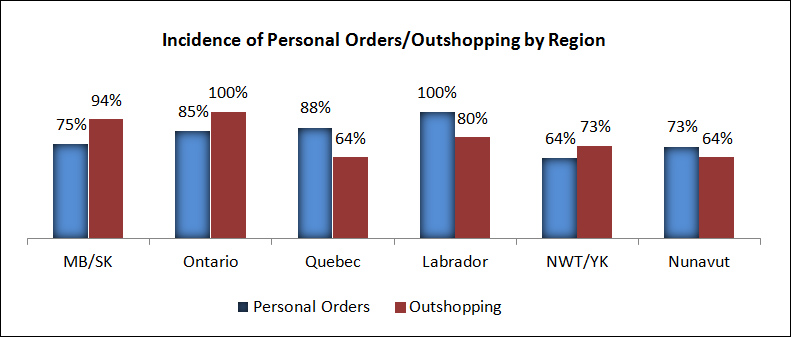
A total of 98 persons responded to this survey
Expand for text description of this chart
Out of 98 respondents, 75 percent identified incidence of personal orders in Manitoba and Saskatchewan while 94 percent identified incidence of outshopping in the same region. 85 percent identified incidence of personal orders in Ontario while 100 percent identified incidence of outshopping in the same region. 88 percent identified incidence of personal orders in Quebec while 64 percent identified incidence of outshopping in the same region. 100 percent identified incidence of personal orders in Labrador while 80 percent identified incidence of outshopping in the same region. 64 percent identified incidence of personal orders in Northwest Territories and Yukon while 73 percent identified incidence of outshopping in the same region. 73 percent identified incidence of personal orders in Nunavut while 64 percent identified incidence of outshopping in the same region.
While the incidence of personal orders or outshopping is similar overall, there is some variation by region, which is likely attributed to transportation costs and access.
Only 8% of managers (n of 8) were able to provide a response to the question, "how much is typically being spent by residents who place personal grocery orders from retailers outside the community?" The vast majority did not know what this amount was.
Of those few managers who did provide a response, a quarter said it was less than $1,000 over the year. The other managers said it was over $1,000. The mean amount was about $2,400.
In your opinion, why are people using personal direct orders?
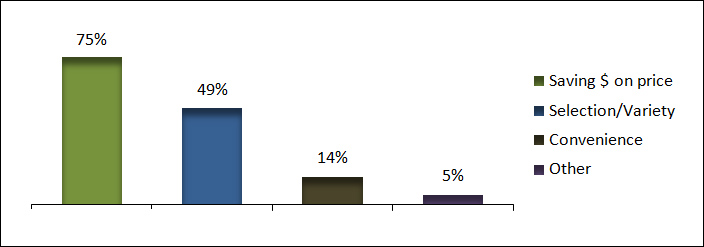
A total of 98 persons responded to this survey
Expand for text description of this chart
Out of 98 respondents, 75 percent stated saving money on price as the reason people use personal direct orders. 49 percent stated selection and variety, 14 percent stated convenience, and five percent stated other as reasons why people use personal direct orders.
Who in the community are the most commonly using direct or personal grocery orders? [MULTIPLE MENTIONS]

A total of 98 persons responded to this survey
Expand for text description of this chart
Out of 98 respondents with multiple mentions for who in the community most commonly uses direct or personal grocery orders, 21 percent identified teachers, 21 percent identified everyone and the general population, 14 percent identified workers from the south, 13 percent identified doctors and nurses, six percent identified law enforcement, five percent identified government staff, four percent identified band office, 15 percent identified other, and 34 percent stated that they do not know.
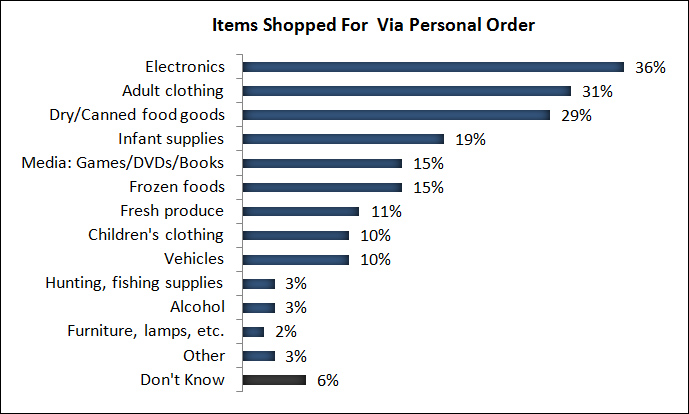
A total of 98 persons responded to this survey
Expand for text description of this chart
Out of 98 respondents with multiple mentions for items shopped for via personal order, 36 percent identified electronics, 31 percent identified adult clothing, 29 percent identified dry or canned food goods, 19 percent identified infant supplies, 15 percent identified media such as games, digital video discs, and books, 15 percent identified frozen foods, 11 percent identified fresh produce, ten percent identified children’s clothing, ten percent identified vehicles, three percent identified hunting or fishing supplies, three percent identified alcohol, two percent identified furniture or lamps and similar items, three percent identified other, and six percent stated they do not know.
Non-grocery items are the most ordered/brought in item with respect to shopping outside the community. In terms of grocery items, a total of 55% of mentions indicate this is being brought in from outside the community.
Perceived Store Performance
In your opinion, how satisfied are your customers with the overall product selection in your stores? Please rate this on a 1 to 10 scale, where '1' means very dissatisfied and '10' means very satisfied.
In your opinion, what is your store's reputation in your community? Please rate this on a 1 to 10 scale, where '1' means very poor and '10' means very good.
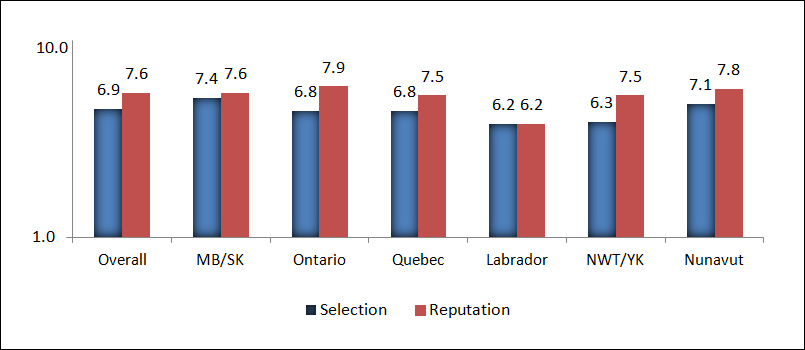
A total of 98 persons responded to this survey
Expand for text description of this chart
Out of 98 respondents using a scale of one to ten, the overall score for perceived customer satisfaction for product selection in store is six point nine. The overall score for perceived reputation of the respondents’ stores’ reputation in the community is seven point six. Split into regions, Manitoba and Saskatchewan has a score of seven point four for selection and seven point six for reputation. Ontario has a score of six point eight for selection and seven point nine for reputation. Quebec has a score of six point eight for selection and seven point five for reputation. Labrador has a score of six point two for selection and reputation. Northwest Territories and Yukon has a score of six point three for selection and seven point five for reputation. Nunavut has a score of seven point one for selection and seven point eight for reputation.
There are a few other noteworthy sub-group findings to these questions:
- Managers of stores in communities with competition from other grocery retailers are more likely to rate their store's reputation higher (mean 7.8 with competition vs. 7.0 no competition).
- Managers who have been managing at the store for 6 years or longer were more apt to rate their store's reputation higher (mean 8.3) compared to those with a shorter tenure as manager (< 2 years – mean 7.2).
In term of frequent requests for other items to be stocked by the store, the majority of managers said there are not many items they can recall being frequently asked about (52% none). Other responses included:
- Other food (18% of mentions)
- Health foods (7% of mentions)
- Electronics (2%)
- Other (19%)
Managers said they did not stock requested items because either they were not available (55% of reasons) or they were only able to carry products authorized by head office (30% of reasons). Other reasons included a lack of space (13%) and cost (10%).
Based on your experience, what could be done to bring the costs of the grocery and merchandise you sell?
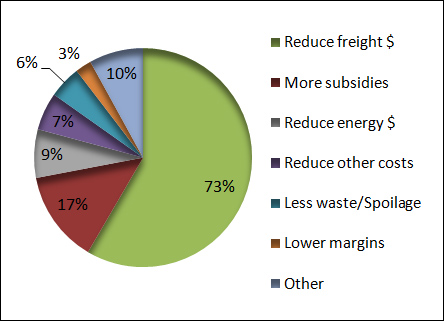
A total of 98 persons responded to this survey
Expand for text description of this chart
Out of 98 respondents for what could be done to bring down costs of grocery and merchandise they sell, 73 percent mentioned reduced freight costs, 17 percent mentioned more subsidies, nine percent mentioned reduced energy costs, seven percent mentioned reduced other costs, six percent mentioned less waste or spoilage, three percent mentioned lower margins, and ten percent mentioned other.
Based on your experience, what could be done to increase the selection of goods for sale in your store?
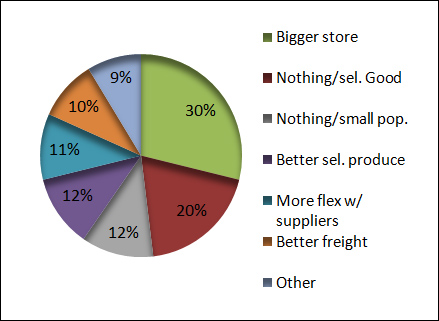
A total of 98 persons responded to this survey
Expand for text description of this chart
Out of 98 respondents for what could be done to increase their store selection of goods for sale, 30 percent mentioned bigger store, 20 percent mentioned nothing or the selection as good, 12 percent mentioned nothing or the small population, 12 percent mentioned better selection for produce, 11 percent mentioned more flexibility with suppliers, ten percent mentioned better freight, and nine percent mentioned other.
If issues of cost and selection in northern retailing can be addressed, who or which groups should be involved in making the required changes? [AIDED LIST MULTIPLE MENTIONS]
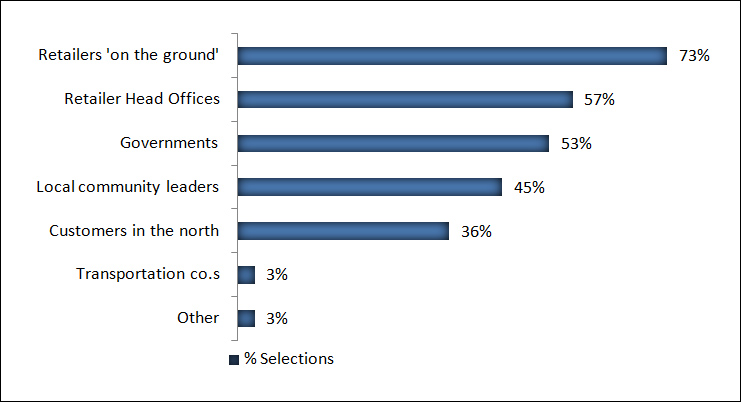
A total of 98 persons responded to this survey
Expand for text description of this chart
Out of 98 respondents with aided list of multiple mentions for who should be involved in making required changes if issues of cost and selection in northern retailing can be addressed, 73 percent mention retailers on the ground, 57 percent mention retailer head offices, 53 percent mention governments, 45 percent mention local community leaders, 36 percent mention customers in the north, three percent mention transportation companies, and three percent mention other.
It is interesting that while managers identify freight costs as the major driver of expenses when retailing the North (73% of mentions), only a handful identify the actual transportation companies as directly being part of the solution.
Beyond the provision of groceries, what other contribution does your store make in the community?
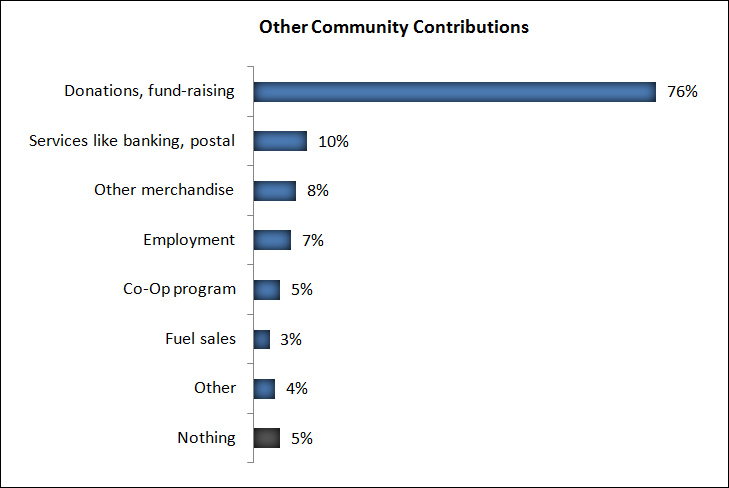
A total of 98 persons responded to this survey
Expand for text description of this chart
Out of 98 respondents for contributions of their stores to the community beyond the provision of groceries, 76 percent mention donations and fund-raising, ten percent mention services like banking and postal, eight percent mention other merchandise, seven percent mention employment, five percent mention co-op program, three percent mention fuel sales, four percent mention other, and five percent mention nothing.
Appendix 2 – Detailed Methodological Discussion
Primary Data Sources
The research team gathered primary data from a number of different sources. Outlined below is a discussion of these different methodological approaches. Researchers Andrew Enns, Al Phillips, Liddie Sorenson-Lawrence, Micheline Bourque and Nadia Papineau-Couture were responsible for the collection of the primary data. Dr. Barry Prentice provided assistance in the analysis and interpretation of findings.
Grocery Store Manager Online Survey
NRG Research Group, in consultation with DIAND officials, drafted a quantitative survey instrument which was subsequently programmed for both online and telephone data collection methodologies. The survey was translated and provided to respondents in both official languages.
The sample list of store managers in NNC-eligible communities was developed by NRG and assisted with lists provided by several of the major northern retail chains. All grocery store retail managers that could be identified were contacted to conduct the survey online. To assist with response rates, NRG Research Group contacted the head offices' of the retail chains stores operating in the NNC area (Northern Store; Co-op, FCNQ, Stanton's and Big Land). This was done to increase the degree of cooperation from the local store managers when approached to respond to the survey.
Through discussions with northern retailers' head offices and through the secondary study phase, NRG developed a reasonably accurate email contact list. This list was used to distribute an email containing an electronic version of the survey and also a link which would allow the retailer to access and complete the survey at NRG Research's secure online survey website.
To assist with response rates, NRG Research Group requested northern retailer head offices to send a letter to their store managers encouraging them to participate in the study.
In some instances, NRG Research Group contacted the retailers by phone to introduce the retail manager to the study. The goal of this initial contact was to gather an email address to send an electronic version of the survey along with a survey link. If internet access was unavailable, NRG Research Group conducted the survey, either by phone or fax.
This manner of data collection resulted in 98 managers completing the survey for a participation rate of about 75%.
One-On-One In-Depth Interviews
In- depth interviews were held with senior officials from the Northern Store, Arctic Co-op, Stanton's and FCNQ, as well as several companies active in supplying personal orders. In addition representatives from several airlines who provide air freight services into the North were also interviewed.
Community Case Studies
The Statement of Work (SoW) called for a number of in-person visits to northern communities to determine, first-hand, the grocery retailing situation. There was a desire to explore in deeper detail the operational aspects of retailing in the community as well as gain an understanding of the impressions of local residents regarding their grocery shopping options.
Originally, the SoW only called for a series of one-on-one interviews with various community leaders. However, NRG Research Group proposed adding to the study methodology two mini-focus groups with local residents (actual shoppers of the local grocery store). NNC staff was particularly interested in understanding more about outshopping and other northern resident consumer behaviour. The groups with residents were helpful in answering these questions. While the data gathered in this manner is not statistically reliable, it nonetheless provides another aspect/facet of consumer behaviour as it relates to grocery shopping within and outside the community.
Once the communities were selected (see Community Profile Selection below) local government officials were contacted to inform them of the study and gain their support for allowing access to various community officials. In each community, the following individuals were interviewed:
- Community service official such as educators, nurses, social workers
- Retailer store managers
- Community elders (when present and available)
- Local government officials
- Local residents
In each community, a local person was hired to assist with recruiting local residents to participate in two mini-focus groups. Typically between 5 to 7 local residents participated in the 1.5 to 2 hour discussion group. Individuals were recruited for the group using a prepared set of qualifying question to ensure they were the primary household shopper in the household. It was decided that the groups should consist entirely of women as this gender typically does the bulk of household shopping. In addition, it was felt that mixing genders in the group may not be as conducive to a free flowing comfortable discussion for some individuals.
In Iqaluit, one of the investigators attended a two day Nunavut Food Security Coalition Meeting (May 6-7) which presented an opportunity to access opinions held by various Nunavut government officials regarding northern grocery retailing.
In addition to recruiting focus group participants, the local support person assisted with the logistics associated with arranging meeting spaces. The groups were moderated using a prepared script of questions by a senior team member, with the local hire available when local dialect translation was required. Residents participating in the study were compensated with a $100 for their time and feedback.
In addition to the focus groups, a senior team member conducted 5 to 6 one-on-one interviews with various community leaders. These individuals usually included a local government official, an education or healthcare professionals and hoteliers or restaurant managers. The final interviews conducted in each community were with any local grocery retail store managers present. In addition to the interview with store managers, a thorough walkabout was conducted around the premises to see first-hand store lay-out and organization including cooling and freezer capacity and warehouse space in general.
Secondary Data Sources
The beginning of the project consisted of a secondary research or existing literature review phase. An Excel database was built which was subsequently updated with demographic, socio-economic data, community infrastructure data, transportation data and retail infrastructure data. The sources of existing data consulted in this phase included Statistics Canada, provincial, territorial and local government bodies and available private sector data.
Cluster Analysis Methodological Discussion
In reviewing opinion and conclusions about the Food Mail Program and NNC, investigators encountered a significant presence of anecdotal information and value judgments being used to support or refute various courses of action pertaining to decisions about the mechanisms for ensuring delivery of nutritious food to northern and isolated communities. In an effort to increase the presence of quantifiable data in the discussion, the investigators proposed a clustering method for identifying the communities for more in-depth data collection. In clustering, the examiner assesses the opportunity for differentiation and similarity across a number of population parameters.
Criteria outside cluster model algorithms:
- Budget (restricted budgets can warrant merging clusters that would otherwise support differentiation)
- Nuances of project management (in certain instances, project management desires clarification or information to assist in analysis outside the strict parameters on the clustering process)
Criteria Available in the Decision Pool:
Governance / Admin:
- Region: Baffin (13), Beaufort-Delta (5), Deh Cho (1), Great Slave Lake (3), Kitikmeot (5), Kivalliq (7), Northern Labrador (6), Northern Manitoba (14), Northern Ontario (15), Northern Quebec (14), Quebec North Shore (10), Sahtu (5), Saskatchewan (3), Southern Labrador (1), Yukon (1)
- Governance Structure
- per capita Healthcare structure
- Education structure
- Policing structure
Demographics:
- Population (93,700)
- Age cohorts, median age
- Aboriginal composition vs. Non-Aboriginal
Socio-economic:
- Median / Mean income
- Unemployment rate
- Community employment concentration
- Local (country) food procurement / processing
Grocery / Retail Infrastructure:
- Number of retail options, scale of retail operations
- Supply chain, distribution structure
- Concentration / level of focus on main retail outlets
- Warehousing options
Air Service / Infrastructure:
- Level of regular air service
- Number of air carriers providing regular service
- Role of weather in limiting consistency of regular air service
- Runway length and surface
- Sea lift options
Sensitivity of NNC to Variation in the Decision Pool Criteria
The main reason for developing clusters in the data collection process was to generate efficiencies in data collection, negating the need to generate a census of NNC communities. The decision to utilize a variable in the development of clusters should be based on the sensitivity of changes in measures of NNC effectiveness in response to or in relation to changes in that variable. At the time of the cluster analysis, two factors were limiting the full utilization of that methodology:
- A lack of detailed, quantified, community-level information used to measure NNC performance (complaint data, % fulfillment, order cycle time, etc.)
- Sparse consistent, quantified data for many NNC communities
Clustering on the Basis of Indices
As described in the 'Criteria Available in the Decision Pool,' there are many combinations of characteristics available to use in cluster definition. To obtain representation from the full spectrum of governance, demographic, socio-economic, grocery / retail services and air service options would require a virtual census of participating communities. By combining the various elements of the decision pool criteria, indices can be created which reduce the variance in the trait (and hence reduce the diversity in the decision criteria). While all five major groupings contribute to variation in the environment for operation of the NNC, NRG Research Group identified that the community selection should focus on the following criteria:
- the governance/administration area (region);
- the traits contributing to variance in the air service options; and
- retail diversity.
Additionally, it is noted that there are varying levels of subsidy under the NNC program. Communities with extensive previous use of the Food Mail Program are eligible for full subsidy under NNC. Communities with moderate previous Food Mail Program usage are eligible for a partial subsidy. Cluster differentiation based on the NNC full / partial subsidy may also prove instructive, but at present, the cluster design does not make that distinction.
Population data in the North is somewhat unreliable, as there is variability over time and some changes are not fully captured. However, based upon current estimates, the 103 communities in the sample frame collectively have about 93,700 persons in residence. From a governance / admin view, these break out as follows:
| Province/Territory | Sum of Communities' Sample Frame | Pct. Of Population in Sample Frame |
|---|---|---|
| Manitoba | 18,789 | 20.1% |
| Newfoundland and Labrador | 3,716 | 4.0% |
| Northwest Territories | 5,754 | 6.1% |
| Nunavut | 31,637 | 33.8% |
| Ontario | 13,384 | 14.3% |
| Quebec | 17,949 | 19.2% |
| Saskatchewan | 2,226 | 2.4% |
| Yukon | 245 | 0.3% |
| Total | 93,700 |
The previous table summarizes the population distribution of the provincial or territorial communities in the communities in the NNC program. In the absence of quantifiable, non-anecdotal data dealing with the relative successes or failures of NNC in the various regions, a proportional approach was recommended. The selection of the 10 communities was first distributed by their share of the sample frame:
| Province/Territory | |
|---|---|
| Manitoba | 2 |
| Newfoundland and Labrador | 1 |
| Northwest Territories | 1 |
| Nunavut | 3 |
| Ontario | 1 |
| Quebec | 2 |
The reader will note that a purely population-based selection will result in sampling from only six jurisdictions, with Saskatchewan and Yukon falling below the threshold.
Air Service Index
The second level of cluster selection focuses on air services. A 'Transportation Index' was created, based upon a compilation of findings about communities':
- Air service frequency and choices
- Runway length and surface
- Selection and frequency of non-air transportation options
The NRG Researchers created an index with each community's air service index ranging from "0" (complete isolation) to '5' (comparative to southern communities' access, with frequent, diverse air choice; long, paved runways; and numerous transportation alternatives). In theory, a '5' is comparable to a southern airport, and no community of the 103 scored a '5'.
It should be remembered that cost per tonne/KM was not factored into the air service index. Even if a community's transportation index is high, low population densities and isolation could be expected to generate high tonne/KM costs for air freight in the North.
Retail Index
The third level of cluster selection involves retail diversity or choice. The index ranges from '-1' (no viable on-site food retail location) to '2' (at least 3 retail locations). A community with only one retail location receives a retail index of '0', corresponding to a lack of choice in food retail selection.
In developing the retail index, incorporation of controlled temperature warehousing would have been useful. While often considered part of a retail location's assets, high quality, dependable warehousing can serve to mitigate the need for frequent air service. In this manner, the elements of the air service index and retail index could be viewed as components of a single 'transportation and warehousing' index. Indeed, in industrial classification systems, the "transportation and warehousing" sector is viewed as a single component. Unfortunately, at present there is inadequate information to support differential analysis of northern communities' warehousing capacity.
A combined air service / retail index was generated for all 103 communities and was used to support the required diversity in selecting communities for on-site review. The Transportation / Retail Index ranged from a high of 5 or 6 for communities such as Iqaluit, NU, Cambridge Bay, NU, or Rankin Inlet, NU, to -1 for communities such as Grise Fiord, NU, Paulatuk, NT or Black Tickle, NL.
Revisiting the planned 10 community distribution, we advocated selecting communities with a mix of Transportation Indexes and Retail Indexes within the following governance / admin structure:
| Province/Territory | Community |
|---|---|
| Manitoba | Island Lake (Garden Hill) (4); Lac Brochet (Northlands) (2) |
| Newfoundland and Labrador | Rigolet (2) |
| Northwest Territories | Aklavik (2) |
| Nunavut | Iqaluit (6); Arviat (3); Igloolik (3) |
| Ontario | Fort Severn (3) |
| Quebec | Quaqtaq (2); Puvirnituq (4) |
These 10 communities cover the governance / administrative spectrum (to the extent feasible) and also address a range of transportation and retail index values. This distribution should provide a reasonable cross section for the in-person phase.
Overall, the distribution of the combined transportation / retail indices for the 10 communities is as follows:
| Transportation / Retail Index | Frequency | % of 10 Communities |
|---|---|---|
| 6 | 1 | 8% |
| 5 | 0 | 0% |
| 4 | 2 | 16% |
| 3 | 3 | 24% |
| 2 | 4 | 42% |
The agreed upon version reflected the results of the clustering process, but also takes into account some preferences expressed by DIAND. As the previous table indicates, we are somewhat light on major transportation/retailing centres (5 or 6) and somewhat heavy on including communities on the lower end of the scale and with greater transportation/retailing challenges (2).
Data Analysis Considerations
The proper or optimal data analysis procedures are determined by the type and distribution of data available.
Secondary Data Compilation
For demographic data we used 2006 and 2011 Census data in meeting the requirements of setting benchmarks for the analysis. One of the main difficulties in using Census data based upon small populations is that confidentiality guidelines often require Statistics Canada to mask out data cells in tabular output. In addition, we used various local government information sources available on the internet. Secondary data has been compiled in various forms, such as sums or means (or medians in the case of significant outliers) in order to address the needs for providing a benchmark data point.
Primary Data Collection
Analysis of collected primary data normally delves into the opportunities and constraints of sampling theory. However, the populations involved in this study are very small, limiting the influence of sampling theory in analysis considerations. With that said, there are still standards for dealing with primary data.
Qualitative Primary Data
In analysis of primary qualitative data, the investigator is faced with frequency distributions of value judgments and opinions that, if un-coded, are virtually unusable unless presented as a listing of anecdotal commentary. We have taken the approach of coding open-ended or text-based responses into distinct concepts or ideas.
Qualitative data measures formed the majority of questioning in the 'community member/ mini-group' discussions. The findings cannot be discussed in a statistical manner, however, the volume of qualitative data gathered allowed for some definitive findings and recommendations to be made resulting from the data. The data gleaned from these components can represent very powerful indicators to be used by policy makers.
Quantitative Primary Data
The survey data from northern retailers is a major source of quantitative data. Means, sums and other resultant measures have been compiled with this quantitative data. Even though sample sizes are small, the data has been organized and examined based on certain sub-group characteristics, such as, geography, managerial experience and the presence of other retail competition.
Missing Values
Integral to the strategy for data analysis methodology is the approach to handling missing data or data outliers. The matter of missing data generated by the need to preserve confidentiality has already been discussed in the context of the use of small area Census data. However, missing data in primary data collection also present problems. When faced with missing data (common with financial data or data collected in self-administered formats), we have attempted a form of central tendency substitution rather than adopting a case-wise deletion strategy.
Our central tendency substitution was to follow a median or modal substitution strategy rather than a mean substitution because in small groups, outliers (particularly at the high end) can dramatically distort the mean. Also, where sample or populations allow, we have used a strata-based substitution strategy. Essentially, if there were 'small', 'medium' and 'large' groupings, we chose the substitution value from the appropriate stratum.
Population Context of NNC Communities Hosting On-Site Data Collection
Population estimates, particularly in sparsely populated areas of Canada, are subject to some variability in accuracy. Using the best information and estimates available, the team developed the following summary.
NNC in the Context of the Northern Population
As of the beginning of the Cluster Development phase of the study, there were 103 communities eligible to tap into the NNC Program. These communities were spread across eight provinces and territories. Column 'E' on the following page summarizes the estimated provincial or territorial total populations for those 103 communities (total: 93,700). Column 'I' presents a province's or territory's share of the national NNC community population. The population component of the North Shore of Quebec is presented separately as that sub-provincial region did not host any in-community data collection sessions.
Nunavut contributed about one-third of the total population of NNC communities in Canada, with virtually the entire territorial population being located in NNC-eligible communities (Column 'J').
Northern Manitoba contributes about one-fifth of the 93,700 NNC-eligible population (Column 'E\'), although only about one-third (31%) of the population in the general NNC geography in Northern Manitoba is located in NNC-eligible communities (Column 'J').
In Newfoundland and Labrador and in the Northwest Territories, only about 14% of the population in the remote areas is in NNC-eligible communities (Column 'J').
On-Site Data Collection and the "Fit" with NNC Communities and the Northern Population
Population Context of NNC-Eligible Communities and Communities Visited
| A Prov/Terr |
B Region |
C NNC Communities |
D NNC On-site Fieldwork Community Population |
E Prov/Terr Population (NNC Communities) |
F NNC On-site Pop'n as Pct of NNC Population (D/Total D) |
G NNC Community Pop'n as Pct of NNC Geography Pop'n (E/F) |
|---|---|---|---|---|---|---|
| Manitoba | Garden Hill | 2,776 | 18,789 | 20.1% | 31.2% | |
| Lac Brochet | 816 | |||||
| NL and Labrador | Rigolet | 306 | 3,716 | 1.8% | 13.9% | |
| Northwest Territories | Beaufort-Delta | Aklavik | 635 | 5,754 | 3.6% | 13.9% |
| Nunavut | Kivalliq | Arviat | 2,318 | 31,637 | 60.1% | 99.2% |
| Baffin | Igloolik | 1,455 | ||||
| Iqaluit | 6,699 | |||||
| Ontario | Fort Severn | 334 | 13,384 | 1.9% | 33.9% | |
| Quebec | Nunavik | Quaqtaq | 376 | 12,090 | 11.9% | 56.8% |
| Puvirnituq | 1,692 | |||||
| North Shore | 5,859 | 0% | 95% | |||
| Saskatchewan | 2,226 | 0% | 100% | |||
| Yukon | 245 | 0% | 100% | |||
| Total | 103 | 17,407 | 93,700 | 100% | 40.8% |
Appendix 3 – Community Profiles (10 Communities)
A major challenge in developing a cluster research design for the study at hand was in acknowledging that, in the purest sense, the sample frame comprises 103 populations, each represented by one community. Clustering is based upon allowing the aspects that communities may have in common to override the fact that the communities are all, in fact, unique. Using the previously described clustering methodology, the team (with input from NNC) chose 10 communities from which to draw representative observations about food retailing in the North. Following are 10 profiles which briefly describe some of the demographic, structural, and 'tombstone' data for each of the communities the team visited in the on-site data collection phase.
Igloolik, NU
Demographic Summary
Total population – 1455 (2011 census)
Population growth since 2006 – Declined 5%
94% Inuit
6% Non-Aboriginal
Unemployment rate – 16% (2012)
Median income - $16,500
Main employers: Mining (Mary River Mining and Roche Bay); local government, health, school, Co-op store and Northern Store
Transportation Summary
Air access: 3 to 5 days a week – First Air; Canadian North
Air service to/from Pond Inlet; Iqaluit and Hall Beach
3900 foot runway – dirt/gravel
Sealift 1 to 2 times a year (usually 1)
Grocery Retailing Presence – 2 Stores
The Northern Store
30 employees, of which 25 (83%) are Inuit
From 2002 to 2012, capital investment in store in Igloolik was - $2,948,150
For 2011 year end, Northern estimates economic impact annually in Igloolik to be $1,022,355
Sales Area 12,023 sq. ft.
Service/Warehouse 6,953 sq. ft. (In the South the ratio of retail to warehouse is about 6 to 1 sq. ft)
Total 18,976 sq. ft (In Igloolik the retail to warehouse ratio is about 2 to 1 sq. ft)
Total Building Investment $2,948,150 ($155 per sq. ft) compared to Giant Tiger in south - $68 a sq. ft
Average Refrigeration Repair incident - $3,500
Energy costs - $0.51/kwh with a Demand Rider (compared to $0.06/kwh in Winnipeg)
Inventory Investment - $1,684,545
Accounts Receivable - $362,282
Total Operating Capital - $2,046,827
Product Losses - $105,596 ($58,051 Giant Tiger)
Arctic Co-op
Co-op operations in Igloolik include a retail store, hotel, restaurant, freight services, property rentals, arts and crafts and convenience store.
Sales Area 12,800 sq. ft. – Main store
Sales area 1,800 sq. ft. – C-Store
Service/Warehouse 5,816 sq. ft. (In the South the ratio of retail to warehouse is about 6 to 1 sq. ft.)
Total 20,416 sq. ft.
Energy costs - $0.51Kwh plus a Demand Rate Fuel Rider (costs est. $875-$900 /month)
Resupply
The Northern Store
Transportation costs over a year - $1,495,234
Winnipeg to Iqaluit (2296 KM) All freight: Air
Ottawa to Iqaluit (2098 KM) All freight: Air
Iqaluit to Igloolik (856 KM) All freight: Air
Winnipeg to Montreal (2760 KM) Dry & Frozen freight for Sealift: Rail (summer)
Montreal to Igloolik (~3000 KM) Dry & Frozen freight: Sealift (summer)
Arctic Co-op
Winnipeg to Iqaluit (2296 KM) All freight: Air
Iqaluit to Igloolik (856 KM) All freight: Air
Winnipeg to Montreal (2760 KM) Dry & Frozen freight for Sealift: Rail (summer)
Montreal to Igloolik (~3000 KM) Dry & Frozen freight: Sealift (summer)
Iqaluit, NU
Demographic Summary
Total population – 6,699 (2011 census)
Population growth since 2006 – Increased 8%
60% Inuit
40% Non-Aboriginal
Unemployment rate – 8%
Median income - $38,000
Main employers: Government of Nunavut, NorthMart, Arctic Ventures MarketPlace
Transportation Summary
Air access: Multiple daily – First Air; Canadian North, Air Greenland
Air service: Major regional hub, to/from Ottawa, Rankin Inlet, numerous others
8600 foot runway – paved
Sealift three times a year
Grocery Retailing Presence – 3 Main Stores
NorthMart
140 employees of which 43 (31%) are Inuit
From 2002 to 2012, capital investment in store in Iqaluit was - $6,318,701
For 2011 year end, Northern estimates economic impact annually in Iqaluit to be $7,767,855
Sales Area 46,870 sq. ft.
Service/Warehouse 31,435 sq. ft. (In the South the ratio of retail to warehouse is about 6 to 1 sq. ft)
Total 78,305 sq. ft (In Iqaluit the retail to warehouse ratio is about 1.5 to 1 sq. ft)
Total Building Investment $6,318,701 ($81 per sq. ft.) compared to Giant Tiger in south - $68 a sq. ft. (Note: representative southern Giant Tiger is about one-fifth the square footage of the NorthMart, yet still has a lower investment per square foot)
Average Refrigeration Repair incident - $3,500
Energy costs - $0.44/kwh (compared to $0.06/kwh in Winnipeg)
Inventory Investment - $6,287,783
Accounts Receivable - $235,838
Total Operating Capital - $6,523,621
Product Losses - $364,616
NWC also operates a QuickStop convenience store in Iqaluit
Arctic Ventures MarketPlace (Co-op Corporate Store as of end of 2012)
55 employees of which 10 are full-time and 45 are part-time
Sales Area 14,000 sq.ft –
Service/Warehouse 5,000 sq.ft
Baffin Canners Ltd.
Extensive renovations to public access sales area within the last year
14 employees, all full-time
Sales Area: 800 sq. ft.
Service / Warehouse 2700 sq. ft.
Resupply
NorthMart
Transportation costs over a year - $5,591,310
Winnipeg to Iqaluit (2296 KM) All freight: Air
Ottawa to Iqaluit (2098 KM) All freight: Air
Winnipeg to Montreal (2760 KM) Dry & Frozen freight for Sealift: Rail (summer)
Montreal to Iqaluit (~3000 KM) Dry & Frozen freight: Sealift (summer)
Arctic Ventures MarketPlace
Winnipeg to Iqaluit All freight: Air
Winnipeg to Montreal freight for Sealift: Rail (summer)
Montreal to Iqaluit (~3000 KM) freight: Sealift (summer)
Baffin Canners Ltd.
Ottawa to Iqaluit All freight: Air
Montreal to Iqaluit freight: Sealift (summer)
Arviat, NU
Demographic Summary
Total population – 2,318 (2011 census)
Population growth since 2006 – 12.5%
92% Inuit
8% Non-Aboriginal
Unemployment rate – 16% (2010)
Median income - $15,200
Main employers: Mining (Agnico Eagle Mines) local government, health, school, Arviat Co-op store and Northern Store, misc. other stores
Transportation Summary
Air access 3-5 days a week – Calm Air; First Air
Air service to/from Churchill; Whale Cove; Rankin Inlet and Baker Lake. Can connect through to Iqaluit. Limited flights to/from Winnipeg and Yellowknife via First Air
3470 foot runway – gravel
Sealift two times a year
Grocery Retailing Presence – 4 Stores
The Northern Store
74 employees of which 59 (80%) are Inuit
Eight long-term employees (1 with 34 years of employment)
From 2002 to 2012 capital investment in store in Arviat was - $2,926,462
For 2011 year end, Northern estimates economic impact annually in Arviat to be $2,200,705
Sales Area 20,090 sq. ft.
Service/Warehouse 4,329 sq. ft. (In the South the ratio of retail to warehouse is about 6 to 1 sq. ft.)
Total 24,419 sq. ft. (In Arviat the retail to warehouse ratio is about 4.6 to 1 sq. ft.)
Total Building Investment $2,926,462 ($120 a sq. ft.)
Average Refrigeration Repair incident - $5,826
Energy costs - $0.72/kwh (compared to $0.06/kwh in Winnipeg)
Inventory Investment - $1,069,244
Accounts Receivable - $970,038
Total Operating Capital - $2,039,282
Product Losses - $153,533
Arctic Co-op
In Arviat, this Co-op consists of a hotel and restaurant. They also provide the cable television services, fuel distribution and property rentals in their community.
15 employees in main store and C-Store, of which 8 are full-time and 7 are part-time
Sales Area 8,000 sq.ft
Service/Warehouse 2,000 sq.ft
Total 10,000 sq.ft
Energy costs - $0.65Kwh
Eskimo Point Lumber
10 employees in retail business, of which 6 are full-time and 4 are part-time
6,000 sq. ft. sales area
4,000 sq. ft. warehouse
Arctic Connections
Opened December 2013 in Arviat, part of operation with retail in Rankin Inlet and significant direct order business out of Winnipeg. Less involved with store front retail.
Resupply
The Northern Store
Transportation costs over a year - $1,775,718
Winnipeg to Thompson (769 KM) All freight: Road
Thompson to Churchill (941 KM) All freight: Rail
Churchill to Arviat (263 KM) All freight: Air
Winnipeg to Montreal (2760 KM) Dry & Frozen freight for Sealift: Rail (summer)
Montreal to Arviat (~4000 KM) Dry & Frozen freight: Sealift (summer)
Arctic Co-op
Winnipeg to Churchill (1005 KM) All freight: Air
Churchill to Arviat (263 KM) All freight: Air
Winnipeg to Thompson All freight: Road
Thompson to Arviat All freight: Air
Eskimo Point Lumber
Winnipeg to Thompson All freight: Road
Thompson to Churchill All freight: Rail
Churchill to Arviat All freight: Air
Arctic Connections
Winnipeg to Thompson All freight: Road
Thompson to Churchill All freight: Rail
Churchill to Arviat All freight: Air
Winnipeg to Montreal All freight for Sealift: Road or Rail (summer)
Montreal to Arviat All freight: Sealift (summer)
Aklavik, NT
Demographic Summary
Total population – 635 (2011 census)
Population growth since 2006 – Increased 7%
92% Inuit
8% Non-Aboriginal
Unemployment rate – 27%
Median income - $16,000
Main employers: Local government, health, school, Northern Store
Transportation Summary
Air access: five days a week – Aklak Air
Air service to/from Inuvik
3000 foot runway –gravel
Sealift has seasonal ferry
Grocery Retailing Presence – 2 Stores
The Northern Store
14 employees of which 10 (71%) are Inuvialuit & Gwich'in
From 2002 to 2012, capital investment in store in Aklavik was - $1,543,873
For 2011 year end, Northern estimates economic impact annually in Aklavik to be $504,760
Sales Area 6,257 sq. ft.
Service/Warehouse 4,748 sq. ft. (In the South the ratio of retail to warehouse is about 6 to 1 sq. ft.)
Total 11,005 sq. ft. (In Aklavik the retail to warehouse ratio is about 1.3 to 1 sq. ft.)
Total Building Investment $1,543,873 ($140 per sq. ft.) compared to Giant Tiger in south - $68 a sq. ft.
Average Refrigeration Repair incident - $3,500
Energy costs - $0.42/kwh (compared to $0.06/kwh in Winnipeg)
Inventory Investment - $915,229
Accounts Receivable - $128,629
Total Operating Capital - $1,043,858
Product Losses - $87,918
Stanton's
13 employees; 3,000 sq. ft. sales area; 3,000 sq. ft. warehouse area; Total 6,000 sq. ft., opened in 2009
Cooperative business model with dividends
Resupply
The Northern Store
Transportation costs over a year - $384,338
Winnipeg to Edmonton (1306 KM) All freight: Road
Winnipeg to Edmonton WR or Barge Freight (dry or frozen): Rail
Edmonton to Inuvik (1945 KM) highly perishable freight: Air
Edmonton to Inuvik (3218 KM) All freight: Road
Edmonton to Hay River (1093 KM) Barge Freight: Road
Hay River to Aklavik Barge freight: Water
Hay River to Yellowknife All freight: Road
Yellowknife to Inuvik (1091 KM) All freight: Air
Inuvik to Aklavik (63.5 KM) All freight: Air
Stanton's
Barge in the summer and winter roads in the winter.
During the winter road season nothing is flown. All trucked and therefore no NNC subsidy applied.
In the summer, perishables are flown in. rest barged on river. The subsidy will be applied when perishables are flown in.
Everything trucked from Edmonton to Inuvik for distribution.
Spring Summer/Fall (September) Re supply
Dry and frozen freight shipped via barge. Fall an important time to stock up for the several months (2 to 3) river closed and winter roads have not opened. Perishables flown in to communities from Inuvik. The NNC subsidy applies. The river barge operates from around June to end of September.
Winter Resupply
All freight, including perishables, arrive to communities via winter road. Nothing is flown in unless there are prolonged road closures due to weather. Winter roads are typically open from December to March. March a big stock-up supply period to carry stores with dry/frozen goods until barge starts running around June.
Stores in Aklavik and Tuk are resupplied with produce and dairy usually three times a week year round.
As a result of resupply flexibility (air, barge and winter road), best before dates are not a big problem.
Garden Hill, MB
Demographic Summary
Total population – 2,776 (2011 census)
Population growth since 2006 – 4.6%
98% First Nation
2% Non-Aboriginal
Unemployment rate – officially at 25% (2006)
Median income - $23,000
Main employers: Local government, health, school, retailers and one outfitter. Also work on winter roads
Transportation Summary
Air access – Perimeter
Cargo service (Northern Store only) with Calm Air
Perimeter provides daily passenger air service to/from Winnipeg to communities in Island lakes regions, including Garden Hill. Several flights a day
3,500 foot runway – crushed rock
Winter road access late January to March
Grocery Retailing Presence
The Northern Store
36 employees of which 32 (89%) are First Nation
Five long-term employees (one with 20+ years of employment)
From 2002 to 2012, capital investment in store in Garden Hill was - $494,061
For 2011 year end, Northern estimates economic impact annually to be $982,580
Sales Area 8,394 sq. ft.
Service/Warehouse 8,873 sq. ft. (In the South the ratio of retail to warehouse is about 6 to 1 sq. ft.)
Total 17,267 sq. ft. (In Garden Hill the retail to warehouse ratio is about 1 to 1 sq. ft.)
Average Refrigeration Repair incident - $2,410
Inventory Investment - $1,183,720
Accounts Receivable - $550,070
Total Operating Capital - $1,733,790
Product losses - $65,658
Sells fuel, also houses an ATM and fast food outlet (KFC)
Other retail stores:
The Convenience Store
Two full time including owner plus some casual employees
The only store located directly in Garden Hill (other stores located on the Island across from the community)
Very limited grocery options
One chest freezer and 6 cooler doors for chilled goods
Approximately 2500 sq. ft.
A mixed array of warehouse space (trailers). No significant effort to resupply on winter road.
Prices are high
Occasionally provides gasoline for sale
Ministik
4-5 full-time staff plus owner
Approximately 4,000 sq. ft.
One small storage garage and semi trailer for warehouse space
Does not do as much winter road supply as he used to. It is cash intensive and prefers not go that route.
Items are expensive in the store as they are flown in
Less than 50% groceries. Large selection of GM and hardware merchandise
Maintains gas pumps
Mikiskew
9-10 full-time staff and 3-4 casual
Approximately 7,500 sq. ft.
A large amount of warehouse space (approx. 10,000 sq. ft) – Home furnishings and appliances requires significant space
Good selection of grocery products, although limited selection of fresh produce
Significant amount of frozen meats
Sells fuel. Biggest tanks
Resupply
The Northern Store
Transportation costs over a year - $695,897
Resupply routes are:
Winnipeg to Thompson (769 KM) All freight: Road
Thompson to Garden Hill (381 KM) All freight: Air (Calm Air)
Thompson to Garden Hill (300 KM) Dry & Frozen: Winter Road (winter)
The Convenience Store
Perimeter Air from Winnipeg – no regular supply schedule
Ministik
Perimeter Air from Winnipeg to Garden Hill – no regular supply schedule
Limited winter road (hauls fuel)
Mikiskew
Perimeter Air from Winnipeg to Garden Hill (regular schedule)
Active on the winter road resupply
Via winter road trucks in a significant amount of gasoline
Lac Brochet, MB
Demographic Summary
Total population – 816 (2011 census)
Population growth since 2006 – Increased 35%
98% Aboriginal
2% Non-Aboriginal
Unemployment rate – 19%
Median income - $19,300
Main employers: Northern Store, Local government, school
Transportation Summary
Air access: daily – Perimeter
Air service: to/from Thompson
3500 foot runway – crushed rock
Sealift: none
Winter Road: Yes
Grocery Retailing Presence
The Northern Store
23 employees, of which 22 (96%) are FN
From 2002 to 2012, capital investment in store in Lac Brochet was - $3,154,450
For 2011 year end, Northern estimates economic impact annually in Lac Brochet to be $494,178
Sales Area 7,872 sq. ft.
Service/Warehouse 3,400 sq. ft. (In the South the ratio of retail to warehouse is about 6 to 1 sq. ft.)
Total 11,272 sq. ft. (in Lac Brochet the retail to warehouse ratio is about 2.3 to 1 sq. ft.)
Total Building Investment $3,154,450 ($280 per sq. ft.) compared to Giant Tiger in south - $68 a sq. ft.
Average Refrigeration Repair incident - $3,500
Energy costs - $0.34/kwh (compared to $0.06/kwh in Winnipeg)
Inventory Investment - $402,895
Accounts Receivable - $361,278
Total Operating Capital - $764,173
Resupply
The Northern Store
Transportation costs over a year - $352,941
Winnipeg to Thompson (769 KM) All freight: Road
Thompson to Lac Brochet (381 KM) All freight: Air
Winnipeg to Lac Brochet (1380 KM) All freight: Road/Winter Road
Fort Severn, ON
Demographic Summary
Total population – 334 (2011 census)
Population growth since 2006 – N/A
99% FN
1% Non-FN
Unemployment rate – N/A
Median income – N/A
Main employers: Self-employed (trapping)
Transportation Summary
Air access: daily – Wasaya Airways
Air service: to/from Sioux Lookout
3518 foot runway – gravel
Sealift one time a year
Winter Road available for short period – very long and costly route
Grocery Retailing Presence – 1 Store
The Northern Store
14 employees, of which 13 (93%) are FN
From 2002 to 2012 capital investment in store in Fort Severn was - $678,104
For 2011 year end, Northern estimates economic impact annually in Fort Severn to be $478,442
Sales Area 3,615 sq. ft.
Service/Warehouse 3,660 sq. ft. (In the South the ratio of retail to warehouse is about 6 to 1 sq. ft.)
Total 7,275 sq. ft. (In Fort Severn the retail to warehouse ratio is about 1 to 1 sq. ft.)
Total Building Investment $678,104 ($93 per sq. ft.)
Average Refrigeration Repair incident - $4,800
Energy costs - $0.11/Kwh (compared to $0.06/kwh in Winnipeg)
Inventory Investment - $417,999
Accounts Receivable - $578,002
Total Operating Capital - $996,001
Product Losses - $68,340
Store also provides gasoline, ATM and postal services
Resupply
The Northern Store
Transportation costs over a year - $429,653
Winnipeg to Fort Severn All freight: Ice road / Winter Road
Winnipeg to Pickle Lake (710 KM) All freight: Road
Pickle Lake to Fort Severn (535 KM) All freight: Air
Quaqtaq, QC
Demographic Summary
Total population – 376 (2011 census)
Population growth since 2006 – Increased 19%
95% Inuit
5% Non-Inuit
Unemployment rate – 13%
Median income - $29,900
Main employers: Co-op Store, government, school, health care providers
Transportation Summary
Air access: daily – Air Inuit
Air service: to/from Kangiqsujuaq, Kangirsuk
3520 foot runway – gravel
Sealift three times a year
Grocery Retailing Presence – 1 Store
Fédération des Co-opératives du Nouveau-Québec
10 full time staff and 3 or 4 part-time staffers
Product Losses – 15% spoilage
Co-op operates a store, hotel, cable TV, Internet and petroleum distribution services as well as some form of banking services
The community post office is also located in the building
A new FCNQ store is presently under construction and is scheduled to open Fall of 2014. This will greatly improve the current crowded circumstances the store operates under.
Puvirnituq, PQ
Demographic Summary
Total population – 1,692 (2011 census)
Population growth since 2006 – Increased 16%
97% Inuit
3% Non-Aboriginal
Unemployment rate – 19%
Median income - $19,400
Main employers: Co-op Store, government, school, health care providers
Transportation Summary
Air access: daily – Air Inuit
Air service: Montreal, Akulivik, Inukjuak, Kuujjuaq
6300 foot runway – gravel
Sealift three times a year
Grocery Retailing Presence – 2 Stores
The Northern Store
5,000 sq. ft. retail with similar amount for warehouse
Spoilage- 15%
Fédération des Co-opératives du Nouveau-Québec
Sales Area 10,000 sq. ft.
Service/ Warehousing: 30,000 sq. ft.
50-50 grocery and general merchandise
Has a large fresh produce section
Spoilage – 2%
Resupply
The Northern Store
Winnipeg to Montreal (2341 KM) All freight: Road
Goods trucked from Montreal to Le Grande
Air freight service 2-3 times a week
2 Sealift sailings—July and October
Puvirnituq serves as a hub to other communities in the proximity.
Smaller planes move the goods from Puvirnituq to other communities.
Fédération des Co-opératives du Nouveau-Québec
Montreal to Purvirnituq – air daily
Rigolet, NL
Demographic Summary
Total population – 306 (2011 census)
Population growth since 2006 – Increased 14%
94% Aboriginal
6% Non-Aboriginal
Unemployment rate – 32%
Median income - $10,800
Main employers: Northern Store
Transportation Summary
Air access: daily – Air Labrador
Air service: to/from Goose Bay, Hopedale, Makhovik, Nain, Natashish, Postville
2500 foot runway – gravel
Sealift has regular ferry in summer
Grocery Retailing Presence
The Northern Store
9 employees, of which 7 (78%) are Inuit
From 2002 to 2012, capital investment in store in Rigolet was - $263,359
For 2011 year end, Northern estimates economic impact annually in Rigolet to be $329,963
Sales Area 5,219 sq. ft.
Service/Warehouse 4,224 sq. ft. (In the South the ratio of retail to warehouse is about 6 to 1 sq. ft.)
Total 9,443 sq. ft. (In Rigolet the retail to warehouse ratio is about 1.2 to 1 sq. ft.)
Total Building Investment $263,359 ($28 per sq. ft.) compared to Giant Tiger in south - $68 a sq. ft.
Average Refrigeration Repair incident - $3,880
Energy costs - $0.22/kwh (compared to $0.06/kwh in Winnipeg)
Inventory Investment - $441,050
Accounts Receivable - $123,728
Total Operating Capital - $564,778
Also houses the Post Office, although it is moving to a new location in a few months. There is an ATM and lottery kiosk in the store. Store provides tax filing services.
Resupply
The Northern Store
Transportation costs over a year - $104,820
Winnipeg to Montreal (2341 KM) All freight: Road
Montreal to Happy Valley (1781 KM) All freight: Road
Happy Valley to Rigolet All freight: Barge (summer only)
Happy Valley to Rigolet (160 KM) All freight: Air