2016-2017: Full Fiscal Year
Table of contents
Overview
- Nutrition North Canada provided 69.7 million dollars in subsidy during its sixth year in operation. 27.7 million kg of nutritious perishable and non-perishable food were subsidized in 2016-2017.
- Ten nutritious perishable foods accounted for more than three quarter of the annual subsidy amount: all fresh fruits, all fresh vegetables, fresh milk, meat, bread, frozen potato products, yogurt, eggs, poultry and UHT milk. These foods receive the program
- Among the items eligible for the lower subsidy level, frozen pizza, unsweetened juice (in containers of more than 250 ml), ice cream, crackers and frozen combination foods received the most subsidy (accounting for close to 5% of the total).
- The Baffin Region of Nunavut and Northern Quebec (Nunavik) received 37% and 23% of the annual subsidy amount, nearly two-thirds of the program's subsidy budget. Nunavut alone received more than half of the annual subsidy amount, for a total of 55%.
- Retailers with stores in northern communities received 92% of the product quantities that were subsidized. These locally-operating stores make the subsidy available to the largest number of community residents as possible since most people shop at the local store. In 2016-2017, about 2% of the subsidized product quantity was shipped to individuals ("personal orders"), more than 3.5% to commercial establishments like hotels or restaurants and about 2% to social institutions such as schools and day cares.
- The yearly report takes into account the addition, as of October 1, 2016, of 37 new communities eligible to a full subsidy per kilogram.
Data by product category
This table shows the amount of subsidy that was distributed by product category between April 1, 2016 and March 31, 2017, and the weight of the products that were subsidized during this period. Product categories are listed in descending order based on the amount of subsidy; the category that received the highest amount of subsidy is listed first, followed by the category that received the second highest amount of subsidy, and so on. Numbers in the table are preliminary. Values are subject to change.
| Product category | $ subsidy | % total $ | kg of food | % total kg |
|---|---|---|---|---|
| Fruit and vegetables (fresh and frozen) | 22,505,921 | 32% | 7,978,967 | 29% |
| Milk (fresh, UHT and canned evaporated) | 12,041,182 | 17% | 4,629,191 | 17% |
| Meat, poultry and fish (fresh and frozen) | 11,591,139 | 17% | 4,448,810 | 16% |
| Bread and bread products, cereals, crackers, flour and plain fresh and frozen pasta. | 8,060,925 | 12% | 3,278,409 | 12% |
| Cheese, yogourt and other dairy products | 5,506,346 | 8% | 2,368,406 | 9% |
| Unsweetened juice | 3,398,589 | 5% | 1,501,847 | 5% |
| Eggs and egg substitutes | 3,064,144 | 4% | 1,253,121 | 5% |
| Combination foods (fresh and frozen) | 1,502,541 | 2% | 1,045,552 | 4% |
| Infant formula and foods prepared specifically for infants | 942,450 | 1% | 357,857 | 1% |
| Cooking oils, margarine, lard, shortening, butter, mayonnaise and salad dressing | 706,008 | 1% | 668,715 | 2% |
| Nuts, seeds, peanut butter and other nut butters, tofu and other meat alternatives | 324,756 | 0% | 111,072 | 0% |
| Non-prescription drugs | 16,608 | 0% | 16,730 | 0% |
| Eligible only for the community of Old Crow, Yukon | 8,757 | 0% | 9,730 | 0% |
| Country Food | 868 | 0% | 1,348 | 0% |
| Total | 69,670,235 | 100% | 27,669,756 | 100% |
| Note: Numbers may not add up due to rounding. | ||||
This chart shows what percentage of the total subsidy transfer between April 1, 2016 and March 31, 2017 was applied to specific product categories. Because non-prescription drugs and country foods shipped from registered northern processing plants received less than 1% of the subsidy transfer these categories are not shown in the chart. The chart is based on data in the table above.
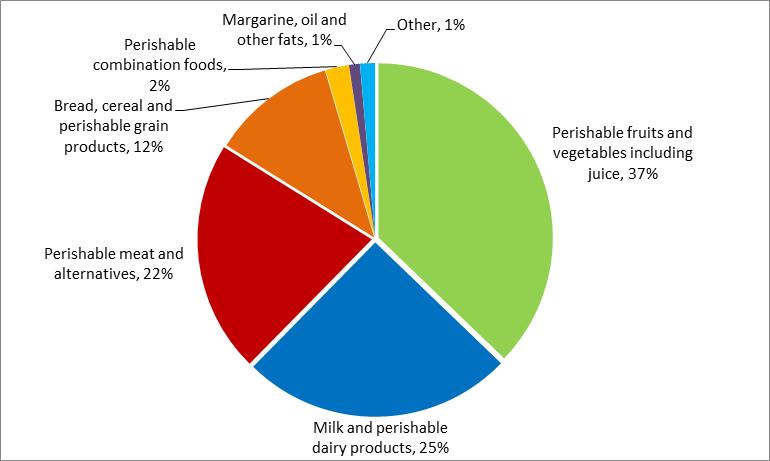
Description for the chart: Percentage of total subsidy payments
The pie graph breaks down the total amount of subsidy spending between April 1, 2016 and March 31, 2017, by categories of eligible products as follows:
- Perishable fruits and vegetables including juice: 37%
- Milk and other perishable dairy products: 25%
- Perishable meat and alternatives: 22%
- Bread, cereal and other perishable grain products: 12%
- Perishable combination foods: 2%
- Margarine, oil and other fats: 1%
- Other:
- Infant formula and infant foods: 1%
- Non-prescription drugs: 0%
- Eligible only for the community of Old Crow, Yukon: 0%
- Country Food: 0%.
Data by province or territory and region
This table shows the amount of subsidy that was distributed by province or territory and region between April 1, 2016 and March 31, 2017, and the product quantities that were subsidized during this period. Within a province or territory, regions are listed in descending order based on the amount of subsidy; the region that received the highest amount of subsidy is listed first, followed by the region that received the second highest amount of subsidy, and so on. Numbers in the table are preliminary. Values are subject to change.
| Region | $ subsidy | % total $ | kg | % total kg |
|---|---|---|---|---|
| Nunavut | ||||
| Baffin | 25,545,040 | 36.7% | 6,760,998 | 24% |
| Kivalliq | 7,931,977 | 11.4% | 3,258,826 | 12% |
| Kitikmeot | 4,647,408 | 6.7% | 1,854,790 | 7% |
| 38,124,424 | 54.7% | 11,874,614 | 43% | |
| Quebec | ||||
| Nunavik (Northern Quebec) |
16,325,435 | 23.4% | 4,976,742 | 18% |
| Quebec North Shore† | 211,204 | 0.3% | 94,855 | 0% |
| 16,536,639 | 23.7% | 5,071,597 | 18% | |
| Ontario | ||||
| 4,610,385 | 6.6% | 4,114,990 | 15% | |
| Manitoba | ||||
| 5,319,466 | 7.6% | 4,309,527 | 16% | |
| Northwest Territories |
||||
| Sahtu | 1,774,317 | 2.5% | 722,349 | 3% |
| Beaufort-Delta | 1,502,352 | 2.2% | 483,271 | 2% |
| Great Slave Lake | 100,282 | 0.1% | 72,477 | 0% |
| Deh Cho | 170 | 0% | 61 | 0% |
| 3,377,121 | 4.8% | 1,278,157 | 5% | |
| Newfoundland and Labrador |
||||
| Labrador | 1,251,561 | 1.8% | 684,644 | 2% |
| Saskatchewan | ||||
| 157,632 | 0.2% | 172,651 | 1% | |
| Yukon | ||||
| 183,549 | 0.3% | 84,407 | 0% | |
| Alberta | ||||
| 109,458 | 0.2% | 79,170 | 0% | |
| Total | 69,670,235 | 100.0% | 27,669,756 | 100% |
| †Quebec North Shore communities are eligible for a subsidy from Nutrition North Canada during the months when there is no marine service to these communities (generally from January to March). Note: Numbers may not add up due to rounding. |
||||
Data by community
This table shows the amount of subsidy that was distributed by community between April 1, 2016 and March 31, 2017, and the product quantities that were subsidized during this period. Within a province or territory, communities are listed in alphabetic order. Numbers in the table are preliminary. Values are subject to change.
| Community | $ subsidy | % total $ | kg | % total kg |
|---|---|---|---|---|
| Nunavut | ||||
| Arctic Bay | 2,186,763 | 3% | 263,599 | 1% |
| Arviat | 1,166,114 | 2% | 707,856 | 3% |
| Baker Lake | 1,995,507 | 3% | 662,352 | 2% |
| Cambridge Bay | 971,548 | 1% | 628,495 | 2% |
| Cape Dorset | 1,644,750 | 2% | 378,846 | 1% |
| Chesterfield Inlet | 391,907 | 1% | 134,871 | 0% |
| Clyde River | 1,758,943 | 3% | 278,525 | 1% |
| Coral harbour | 925,043 | 1% | 242,204 | 1% |
| Gjoa Haven | 1,163,469 | 2% | 375,136 | 1% |
| Grise Fiord | 857,086 | 1% | 54,423 | 0% |
| Hall Beach | 1,103,437 | 2% | 206,868 | 1% |
| Igloolik | 2,483,347 | 4% | 469,420 | 2% |
| Iqaluit | 7,566,556 | 11% | 3,627,678 | 13% |
| Kimmirut | 751,449 | 1% | 145,556 | 1% |
| Kugaaruk | 693,833 | 1% | 183,694 | 1% |
| Kugluktuk | 955,007 | 1% | 414,427 | 2% |
| Naujaat (Repulse Bay) | 1,027,824 | 2% | 263,711 | 1% |
| Pangnirtung | 1,618,202 | 2% | 419,262 | 2% |
| Pond Inlet | 3,545,648 | 5% | 452,771 | 2% |
| Qikiqtarjuaq | 717,235 | 1% | 158,768 | 1% |
| Rankin Inlet | 2,136,111 | 3% | 1,131,993 | 4% |
| Resolute | 990,597 | 1% | 99,179 | 0% |
| Sanikiluaq | 321,026 | 0% | 206,103 | 1% |
| Taloyoak | 863,551 | 1% | 253,037 | 1% |
| Whale Cove | 289,472 | 0% | 115,840 | 0% |
| 38,124,424 | 55% | 11,874,614 | 43% | |
| Quebec | ||||
| Akulivik | 741,851 | 1% | 172,704 | 1% |
| Aupaluk | 290,934 | 0% | 67,420 | 0% |
| Chevery | 21,109 | 0% | 30,791 | 0% |
| Gethsémani (la romaine) | 69,609 | 0% | 30,791 | 0% |
| Harrington Harbour | 15,370 | 0% | 6,792 | 0% |
| Inukjuak | 1,545,716 | 2% | 589,187 | 2% |
| Ivujivik | 556,067 | 1% | 108,237 | 0% |
| Kangiqsualujjuaq | 1,050,301 | 2% | 263,087 | 1% |
| Kangiqsujuaq | 1,181,138 | 2% | 240,843 | 1% |
| Kangirsuk | 879,626 | 1% | 173,080 | 1% |
| Kuujjuaq | 2,793,344 | 4% | 1,161,006 | 4% |
| Kuujjuarapik | 1,470,073 | 2% | 762,751 | 3% |
| La Tabatière | 22,429 | 0% | 9,919 | 0% |
| Mutton Bay | 1,436 | 0% | 630 | 0% |
| Port-Menier | 3,728 | 0% | 2,414 | 0% |
| Puvirnituq | 2,151,016 | 3% | 588,676 | 2% |
| Quaqtaq | 672,207 | 1% | 130,160 | 0% |
| Saint-Augustin / Pakuashipi | 64,235 | 0% | 28,837 | 0% |
| Salluit | 2,249,173 | 3% | 458,380 | 2% |
| Tasiujaq | 402,270 | 1% | 100,764 | 0% |
| Tête-à-la-Baleine | 13,289 | 0% | 5,979 | 0% |
| Umiujaq | 341,718 | 0% | 160,447 | 1% |
| 16,536,639 | 24% | 5,071,597 | 19% | |
| Ontario | ||||
| Angling lake | 28,973 | 0% | 28,345 | 0% |
| Attawapiskat | 720,084 | 1% | 589,413 | 2% |
| Bearskin Lake | 147,066 | 0% | 132,382 | 1% |
| Big Trout Lake | 491,290 | 1% | 316,433 | 1% |
| Cat Lake | 64,983 | 0% | 67,173 | 0% |
| Deer Lake | 135,190 | 0% | 113,199 | 0% |
| Eabamet Lake (Fort Hope) | 74,919 | 0% | 70,549 | 0% |
| Favourable Lake (Sandy Lake) | 350,376 | 1% | 272,409 | 1% |
| Fort Albany | 277,653 | 0% | 246,781 | 1% |
| Fort Severn | 364,157 | 1% | 154,841 | 1% |
| Kasabonika | 192,513 | 0% | 258,239 | 1% |
| Kashechewan | 498,900 | 1% | 472,301 | 2% |
| Keewaywin | 56,472 | 0% | 46,178 | 0% |
| Kingfisher Lake | 79,141 | 0% | 104,991 | 0% |
| Lansdowne House | 44,234 | 0% | 34,826 | 0% |
| Muskrat Dam | 71,031 | 0% | 57,709 | 0% |
| North Spirit Lake | 17,614 | 0% | 18,067 | 0% |
| Ogoki | 1,581 | 0% | 2,409 | 0% |
| Peawanuck | 186,979 | 0% | 86,342 | 0% |
| Pikangikum | 219,265 | 0% | 353,130 | 1% |
| Poplar Hill | 65,396 | 0% | 61,288 | 0% |
| Sachigo Lake | 85,960 | 0% | 135,169 | 1% |
| Summer Beaver | 34,693 | 0% | 27,312 | 1% |
| Wawakapewin | 0 | 0% | 0 | 0% |
| Weagamow Lake | 130,089 | 0% | 170,616 | 1% |
| Webequie | 145,573 | 0% | 110,019 | 1% |
| Wunnummin Lake | 126,256 | 0% | 184,871 | 1% |
| 4,610,385 | 7% | 4,114,990 | 15% | |
| Manitoba | ||||
| Berens River | 83,778 | 0% | 109,133 | 0% |
| Brochet | 85,319 | 0% | 71,942 | 0% |
| Gods Lake Narrows | 422,694 | 1% | 398,562 | 1% |
| Gods River | 166,978 | 0% | 159,898 | 1% |
| Granville Lake | 0 | 0% | 0 | 0% |
| Island Lake (Garden Hill) | 924,687 | 1% | 641,906 | 2% |
| Lac Brochet | 224,405 | 0% | 181,755 | 1% |
| Little Grand Rapids | 181,879 | 0% | 171,538 | 1% |
| Negginan (Poplar River) | 241,217 | 0% | 207,751 | 1% |
| Oxford House | 853,311 | 1% | 702,638 | 3% |
| Pauingassi | 89,731 | 0% | 83,365 | 0% |
| Red Sucker Lake | 265,287 | 0% | 192,642 | 1% |
| Shamattawa | 197,463 | 0% | 258,083 | 1% |
| St. Theresa Point | 1,099,229 | 2% | 787,046 | 3% |
| Tadoule Lake | 60,588 | 0% | 46,297 | 0% |
| Waasagomach | 395,193 | 1% | 274,035 | 1% |
| York Landing | 27,707 | 0% | 22,938 | 0% |
| 5,319,466 | 8% | 4,309,527 | 16% | |
| Northwest Territories | ||||
| Aklavik | 134,575 | 0% | 91,778 | 0% |
| Colville Lake | 163,025 | 0% | 32,700 | 0% |
| Deline | 372,322 | 1% | 152,289 | 1% |
| Fort Good Hope | 438,612 | 1% | 167,092 | 1% |
| Gameti | 0 | 0% | 0 | 0% |
| Lutsel K'e | 100,281 | 0% | 72,445 | 0% |
| Norman Wells | 481,289 | 1% | 238,470 | 1% |
| Paulatuk | 264,724 | 0% | 75,758 | 0% |
| Sachs Harbour | 209,619 | 0% | 36,727 | 0% |
| Sambaa K'e (Trout Lake) | 170 | 0% | 61 | 0% |
| Tuktoyaktuk | 359,283 | 1% | 153,038 | 1% |
| Tulita | 319,069 | 1% | 131,797 | 0% |
| Ulukhaktok (Holman) | 534,151 | 1% | 125,971 | 0% |
| Wha Ti | 1 | 0% | 24 | 0% |
| Wekweèti | 0 | 0% | 0 | 0% |
| 3,377,121 | 5% | 1,278,157 | 5% | |
| Newfoundland and Labrador | ||||
| Black Tickle | 33,287 | 0% | 19,874 | 0% |
| Hopedale | 161,928 | 0% | 98,165 | 0% |
| Makkovik | 101,601 | 0% | 70,984 | 0% |
| Nain | 501,971 | 1% | 210,919 | 1% |
| Natuashish | 307,817 | 0% | 168,368 | 1% |
| Postville | 54,639 | 0% | 36,551 | 0% |
| Rigolet | 90,318 | 0% | 79,783 | 0% |
| Williams Harbour | 0 | 0% | 0 | 0% |
| 1,251,561 | 2% | 684,644 | 2% | |
| Saskatchewan | ||||
| Black Lake | 0 | 0% | 0 | 0% |
| Fond-du-Lac | 118,590 | 0% | 137,740 | 0% |
| Stony Rapids | 0 | 0% | 0 | 0% |
| Uranium City | 4,069 | 0% | 2,923 | 0% |
| Wollaston Lake | 34,973 | 0% | 31,988 | 0% |
| 157,632 | 0% | 172,651 | 1% | |
| Yukon | ||||
| Old Crow | 183,549 | 0% | 84,407 | 0% |
| Alberta | ||||
| Fort Chipewyan | 109,458 | 0% | 79,170 | 0% |
| Total | 69,670,235 | 100% | 27,669,756 | 100% |
| † Quebec North Shore communities are eligible for a subsidy from Nutrition North Canada during the months when there is no marine service to these communities (generally from January to March). Note: Numbers may not add up due to rounding. | ||||
Data per capita
This table shows the amount of subsidy that was distributed and the product quantities that were subsidized between April 1, 2016 and March 31, 2017, on a per capita (per person) basis. The table includes all communities that were eligible for a full subsidy all year. Population counts from the 2016 Census were used to calculate the per capita values. Within a province or territory, communities are listed in alphabetical order. Numbers in the table are preliminary. Values are subject to change.
| Community | Population 2016 |
$ subsidy | per capita | kg | per capita |
|---|---|---|---|---|---|
| Nunavut | |||||
| Arctic Bay | 868 | 2,186,763 | 2,519 | 263,599 | 304 |
| Arviat | 2,657 | 1,166,114 | 439 | 707,856 | 266 |
| Baker Lake | 2,069 | 1,995,507 | 964 | 662,352 | 320 |
| Cambridge Bay | 1,766 | 971,548 | 550 | 628,495 | 356 |
| Cape Dorset | 1,441 | 1,644,750 | 1,141 | 378,846 | 263 |
| Chesterfield Inlet | 437 | 391,907 | 897 | 134,871 | 309 |
| Clyde River | 1,053 | 1,758,943 | 1,670 | 278,525 | 265 |
| Coral Harbour | 891 | 925,043 | 1,038 | 242,204 | 272 |
| Gjoa Haven | 1,324 | 1,163,469 | 879 | 375,136 | 283 |
| Grise Fiord | 129 | 857,086 | 6,644 | 54,423 | 422 |
| Hall Beach | 848 | 1,103,437 | 1,301 | 206,868 | 244 |
| Igloolik | 1,682 | 2,483,347 | 1,476 | 469,420 | 279 |
| Iqaluit | 7,740 | 7,566,556 | 978 | 3,627,678 | 469 |
| Kimmirut | 389 | 751,449 | 1,932 | 145,556 | 374 |
| Kugaaruk | 933 | 693,833 | 744 | 183,694 | 197 |
| Kugluktuk | 1,491 | 955,007 | 641 | 414,427 | 278 |
| Naujaat (Repulse Bay) | 1,082 | 1,027,824 | 950 | 263,711 | 244 |
| Pangnirtung | 1,481 | 1,618,202 | 1,093 | 419,262 | 283 |
| Pond Inlet | 1,617 | 3,545,648 | 2,193 | 452,771 | 280 |
| Qikiqtarjuaq | 598 | 717,235 | 1,199 | 158,768 | 265 |
| Rankin Inlet | 2,842 | 2,136,111 | 752 | 1,131,993 | 398 |
| Resolute | 198 | 990,597 | 5,003 | 99,179 | 501 |
| Sanikiluaq | 882 | 321,026 | 364 | 206,103 | 234 |
| Taloyoak | 1,029 | 863,551 | 839 | 253,037 | 246 |
| Whale Cove | 435 | 289,472 | 665 | 115,840 | 266 |
| Quebec | |||||
| Akulivik | 633 | 741,851 | 1,172 | 172,704 | 273 |
| Aupaluk | 209 | 290,934 | 1,392 | 67,420 | 323 |
| Chevery | 236 | 21,109 | 89 | 9,494 | 40 |
| Gethsémani (La Romaine) | 977 | 69,609 | 71 | 30,791 | 32 |
| Harrington Harbour | 229 | 15,370 | 67 | 6,792 | 30 |
| Inukjuak | 1,757 | 1,545,716 | 880 | 589,187 | 335 |
| Ivujivik | 414 | 556,067 | 1,343 | 108,237 | 261 |
| Kangiqsualujjuaq | 942 | 1,050,301 | 1,115 | 263,087 | 279 |
| Kangiqsujuaq | 750 | 1,181,138 | 1,575 | 240,843 | 321 |
| Kangirsuk | 567 | 879,626 | 1,551 | 173,080 | 305 |
| Kuujjuaq | 2,754 | 2,793,344 | 1,014 | 1,161,006 | 422 |
| Kuujjuarapik | 1,670 | 1,470,073 | 880 | 762,751 | 457 |
| La Tabatière | 265 | 22,429 | 85 | 9,919 | 37 |
| Mutton Bay | 163 | 1,436 | 9 | 630 | 4 |
| Puvirnituq | 1,779 | 2,151,016 | 1,209 | 588,676 | 331 |
| Quaqtaq | 403 | 672,207 | 1,668 | 130,160 | 323 |
| Saint-Augustin / Pakuashipi | 682 | 64,235 | 94 | 28,837 | 42 |
| Salluit | 1,483 | 2,249,173 | 1,517 | 458,380 | 309 |
| Tasiujaq | 369 | 402,270 | 1,090 | 100,764 | 273 |
| Tête-à-la-Baleine | 145 | 13,289 | 92 | 5,979 | 41 |
| Umiujaq | 442 | 341,718 | 773 | 160,447 | 363 |
| Northwest Territories | |||||
| Aklavik | 590 | 134,575 | 228 | 91,778 | 156 |
| Colville Lake | 129 | 163,025 | 1,264 | 32,700 | 253 |
| Deline | 533 | 372,322 | 699 | 152,289 | 286 |
| Fort Good Hope | 516 | 438,612 | 850 | 167,092 | 324 |
| Norman Wells | 778 | 481,289 | 619 | 238,470 | 307 |
| Paulatuk | 265 | 264,724 | 999 | 75,758 | 286 |
| Sachs Harbour | 103 | 209,619 | 2,035 | 36,727 | 357 |
| Sambaa K'e (Trout Lake) | 88 | 170 | 2 | 61 | 1 |
| Tuktoyaktuk | 898 | 359,283 | 400 | 153,038 | 170 |
| Tulita | 477 | 319,069 | 669 | 131,797 | 276 |
| Ulukhaktok (Holman) | 396 | 534,151 | 1,349 | 125,971 | 318 |
| Manitoba | |||||
| Gods Lake Narrows | 982 | 422,694 | 430 | 398,562 | 406 |
| Gods River | 643 | 166,978 | 260 | 159,898 | 249 |
| Island Lake (Garden Hill) | 2,591 | 924,687 | 357 | 641,906 | 248 |
| Lac Brochet | 728 | 224,405 | 308 | 181,755 | 250 |
| Little Grand Rapids | 810 | 181,879 | 225 | 171,538 | 212 |
| Negginan (Poplar River) | 866 | 241,217 | 279 | 207,751 | 240 |
| Oxford House | 1,950 | 853,311 | 438 | 702,638 | 360 |
| Pauingassi | 271 | 89,731 | 331 | 83,365 | 308 |
| Red Sucker Lake | 675 | 265,287 | 393 | 192,642 | 285 |
| . Theresa Point | 3,262 | 1,099,229 | 337 | 787,046 | 241 |
| Waasagomach | 1,403 | 395,193 | 282 | 274,035 | 195 |
| Ontario | |||||
| Attawapiskat | 1,501 | 720,084 | 480 | 589,413 | 393 |
| Bearskin Lake | 355 | 147,066 | 414 | 132,382 | 373 |
| Big Trout Lake | 1,024 | 491,290 | 480 | 316,433 | 309 |
| Fort Albany | 759 | 277,653 | 366 | 246,781 | 325 |
| Fort Severn | 361 | 364,157 | 1,009 | 154,841 | 429 |
| Kashechewan | 1,404 | 498,900 | 355 | 472,301 | 336 |
| Muskrat Dam | 281 | 71,031 | 253 | 57,709 | 205 |
| Peawanuck | 195 | 186,979 | 959 | 86,342 | 443 |
| Newfoundland and Labrador | |||||
| Black Tickle | 150 | 33,287 | 222 | 19,874 | 132 |
| Hopedale | 574 | 161,928 | 282 | 98,165 | 171 |
| Makkovik | 377 | 101,601 | 269 | 70,984 | 188 |
| Nain | 1,125 | 501,971 | 446 | 210,919 | 187 |
| Natuashish | 936 | 307,817 | 329 | 168,368 | 180 |
| Postville | 177 | 54,639 | 309 | 36,551 | 207 |
| Rigolet | 305 | 90,318 | 296 | 79,783 | 262 |
| Yukon | |||||
| Old Crow | 221 | 183,549 | 831 | 84,407 | 382 |
| 81,450 | 66,991,053 | 822 | 24,775,864 | 304 | |
| †Quebec North Shore communities are eligible for a subsidy from Nutrition North Canada during the months when there is no marine service to these communities (generally from January to March). Note 1: The new communities added to the program with the full subsidy in October 2016 were not included in this table as only six months of data were available, which would have skewed the per capita annual data. Note 2: Numbers may not add up due to rounding. |
|||||
Data per retailer or supplier
This table shows the amount of subsidy that was distributed and the product quantities that were subsidized between April 1, 2016 and March 31, 2017, by registered retailer and supplier. Retailers and suppliers are listed in descending order based on the subsidy amount; the recipient that received the highest amount of subsidy is listed first, followed by the community that received the second highest amount of subsidy, and so on. Numbers in the table are preliminary. Values are subject to change.
| Retailers / Suppliers | $ subsidy | % Total $ | kg | % Total kg |
|---|---|---|---|---|
| NorthWest Company | 35,897,43 | 52% | 16,293,863 | 59% |
| Arctic Co-operatives Ltd | 11,651,175 | 17% | 3,355,164 | 12% |
| Fédération des coopératives du nord du Québec | 9,057,320 | 13% | 2,425,136 | 9% |
| Les Consultants de l'Arctique | 3,516,181 | 5% | 1,158,890 | 4% |
| Marché Daoust | 2,537,619 | 4% | 909,800 | 3% |
| Ben Deshaies Grossiste | 1,356,016 | 2% | 591,891 | 2% |
| Hamilton Wholesalers | 824,493 | 1% | 429,238 | 2% |
| Northern Shopper | 707,051 | 1% | 312,251 | 1% |
| South Camp Enterprises (953731 NWT Ltd) | 693,457 | 1% | 59,995 | 0% |
| Pratts Ltd | 675,684 | 1% | 546,425 | 1% |
| Harris Meats | 596,583 | 1% | 422,830 | 2% |
| Meechim North | 438,900 | 1% | 279,519 | 1% |
| Stanton's | 366,320 | 1% | 146,275 | 1% |
| Newfoundland Multi-food Limited | 249,923 | 0% | 142,653 | 0% |
| Rampart Rentals | 163,498 | 0% | 76,587 | 0% |
| Valu Lots | 144,508 | 0% | 85,292 | 0% |
| Distribution Côte Nord | 117,520 | 0% | 51,927 | 0% |
| Shaw Family Bakery | 75,308 | 0% | 52,585 | 0% |
| Atlantic Grocery Distributors | 68,169 | 0% | 48,462 | 0% |
| Marché Central du Nord | 66,893 | 0% | 19,327 | 0% |
| Distribution GFD Inc. | 56,605 | 0% | 26,358 | 0% |
| Arctic Connection | 45,772 | 0% | 27,960 | 0% |
| Neechi Foods Co-Op Ltd. | 40,391 | 0% | 26,079 | 0% |
| Cactus Holding (M) | 38,395 | 0% | 10,744 | 0% |
| Arctic Buying Company | 31,660 | 0% | 16,336 | 0% |
| ALIX Enterprises Ltd | 30,807 | 0% | 27,266 | 0% |
| Public Meat | 28,400 | 0% | 25,302 | 0% |
| Labrador Investments Ltd | 27,098 | 0% | 12,079 | 0% |
| JG Grocery | 26,755 | 0% | 20,547 | 0% |
| Northern Fancy Meat | 26,429 | 0% | 10,425 | 0% |
| Eskimo Point Lumber Supply | 26,222 | 0% | 16,683 | 0% |
| Distribution M. Fournier | 18,627 | 0% | 8,199 | 0% |
| Hatchet Lake Band Store | 13,359 | 0% | 8,725 | 0% |
| La Charcuterie D.E.T. inc. | 12,639 | 0% | 5,812 | 0% |
| Recinos | 8,324 | 0% | 1,778 | 0% |
| AN Food Distributors | 7,900 | 0% | 3,085 | 0% |
| Foodshare Toronto | 5,931 | 0% | 1,763 | 0% |
| Saslove's Meat Market Ltd. | 5,079 | 0% | 12,079 | 0% |
| Coastal Meats | 3,971 | 0% | 1,759 | 0% |
| BBE Expediting Ltd. | 3,296 | 0% | 1,218 | 0% |
| Cantor's Grocery Co-Op Ltd. | 2,095 | 0% | 914 | 0% |
| Parkes General Store | 1,909 | 0% | 1,295 | 0% |
| Les Entreprises Henry Jenniss Inc. | 1,842 | 0% | 801 | 0% |
| Nibinamik Community Store | 1,458 | 0% | 1,198 | 0% |
| AKI Energy | 1,159 | 0% | 725 | 0% |
| Jasman Ventures Inc. | 60 | 0% | 38 | 0% |
| Total | 69,670,235 | 100% | 27,669,756 | 100% |
| Note: Numbers may not add up due to rounding. | ||||
This table shows the amount of subsidy that was distributed and the product quantities that were subsidized between April 1, 2016 and March 31, 2017, by the type of client that purchased the subsidized products. Numbers in the table are preliminary. Values are subject to change.
| Client | $ subsidy | % total $ | kg | % total kg |
|---|---|---|---|---|
| Retailers | 63,783,782 | 91.6% | 25,489,467 | 92.1% |
| Establishments ( e.g., restaurant) | 2,694,454 | 3.9% | 959,042 | 3.5% |
| Individuals ("personal orders") | 1,382,675 | 2.0% | 615,712 | 2.2% |
| Social institutions ( e.g., daycare, school) | 1,809,324 | 2.6% | 605,536 | 2.2% |
| Grand Total | 69,670,235 | 100% | 27,669,756 | 100% |
| Note: Numbers may not add up due to rounding. | ||||